Temperature Changes.
11th February 2026
A wee bit colder today than it was yesterday, but otherwise not much change. It was cloudy and windy on the tops with some fresh snowfall. The existing snowpack which got wet a few days ago has frozen and is firm and stable. There was a fair bit of fresh snow blowing around. Although deposits of fresh snow were not particularly extensive, they were not particularly stable.
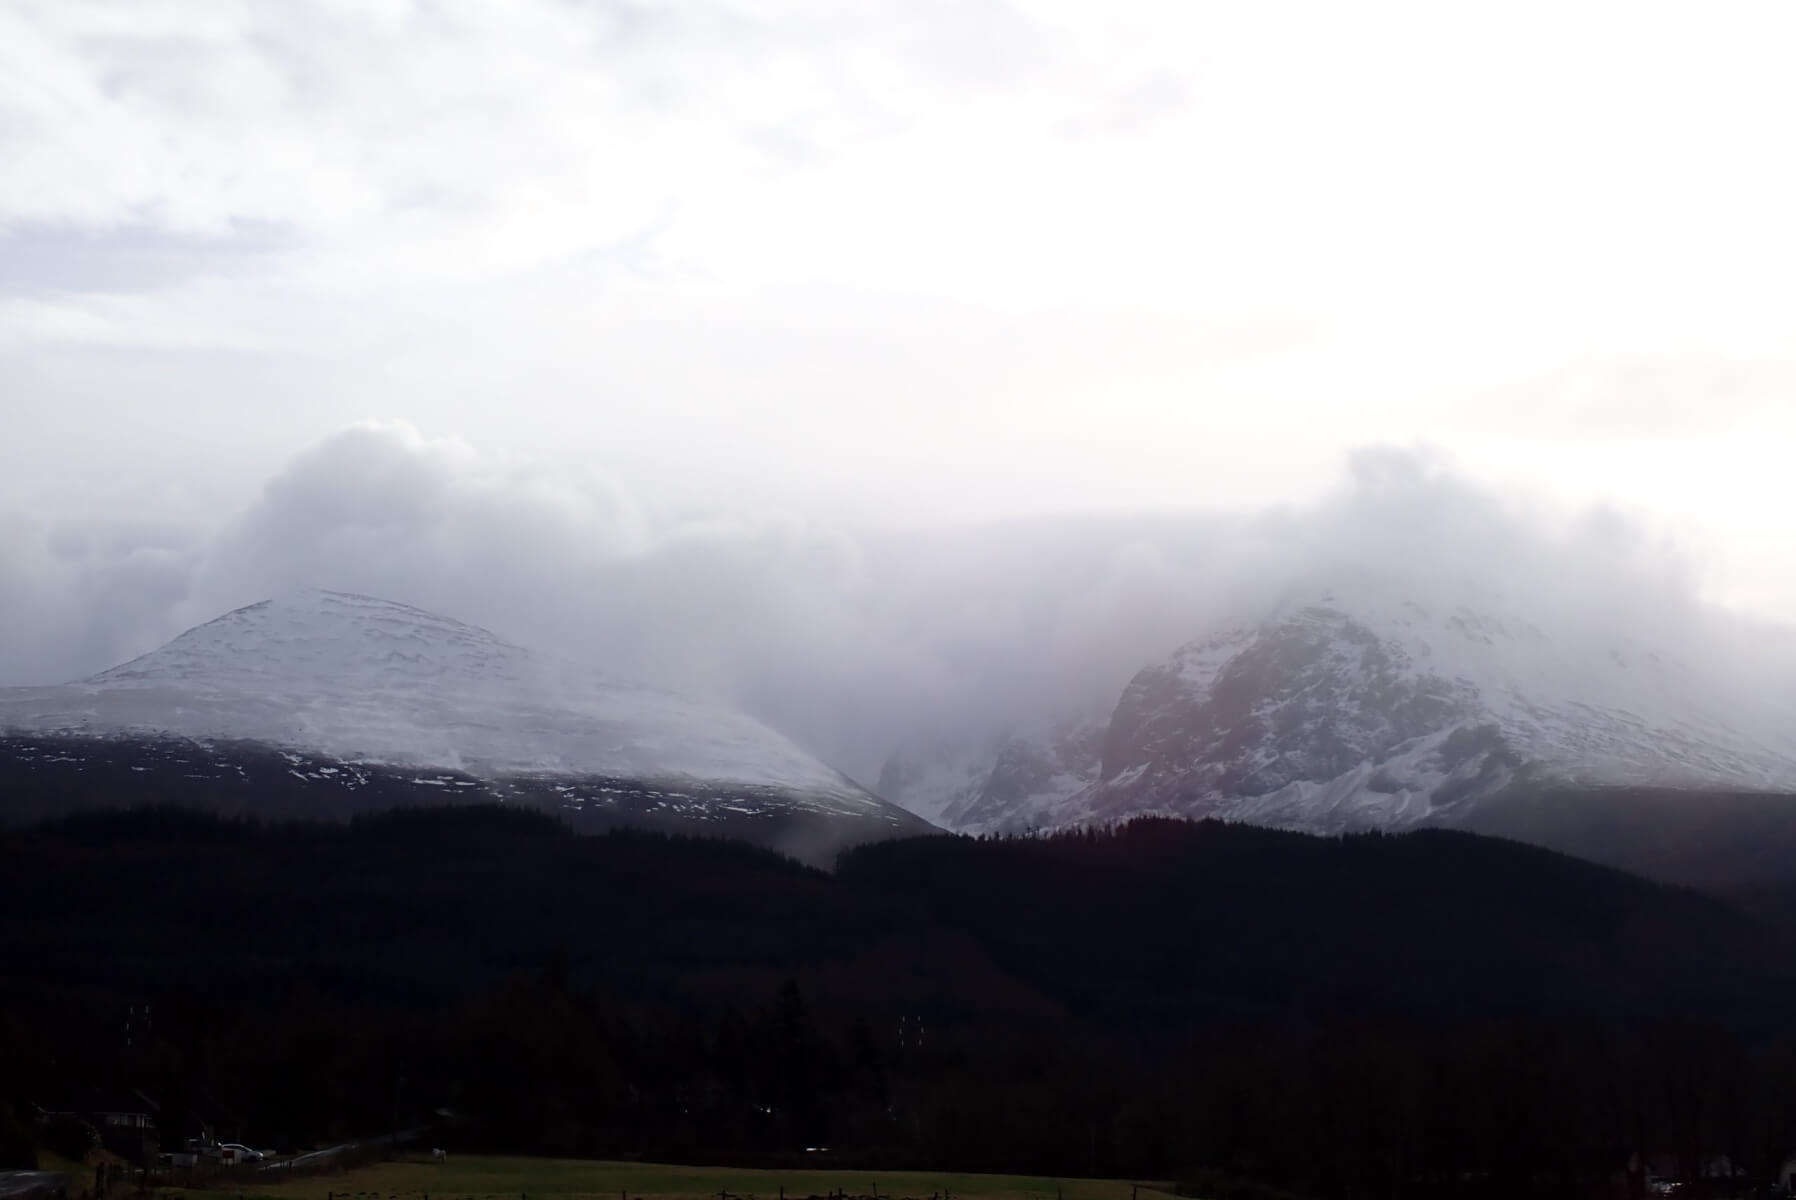
Looking up towards Ben Nevis and Carn Mor Dearg around midday. As has been typical for the past few week the summits were in the cloud, the winds were strong at altitude while it was quite pleasant down in the glens.
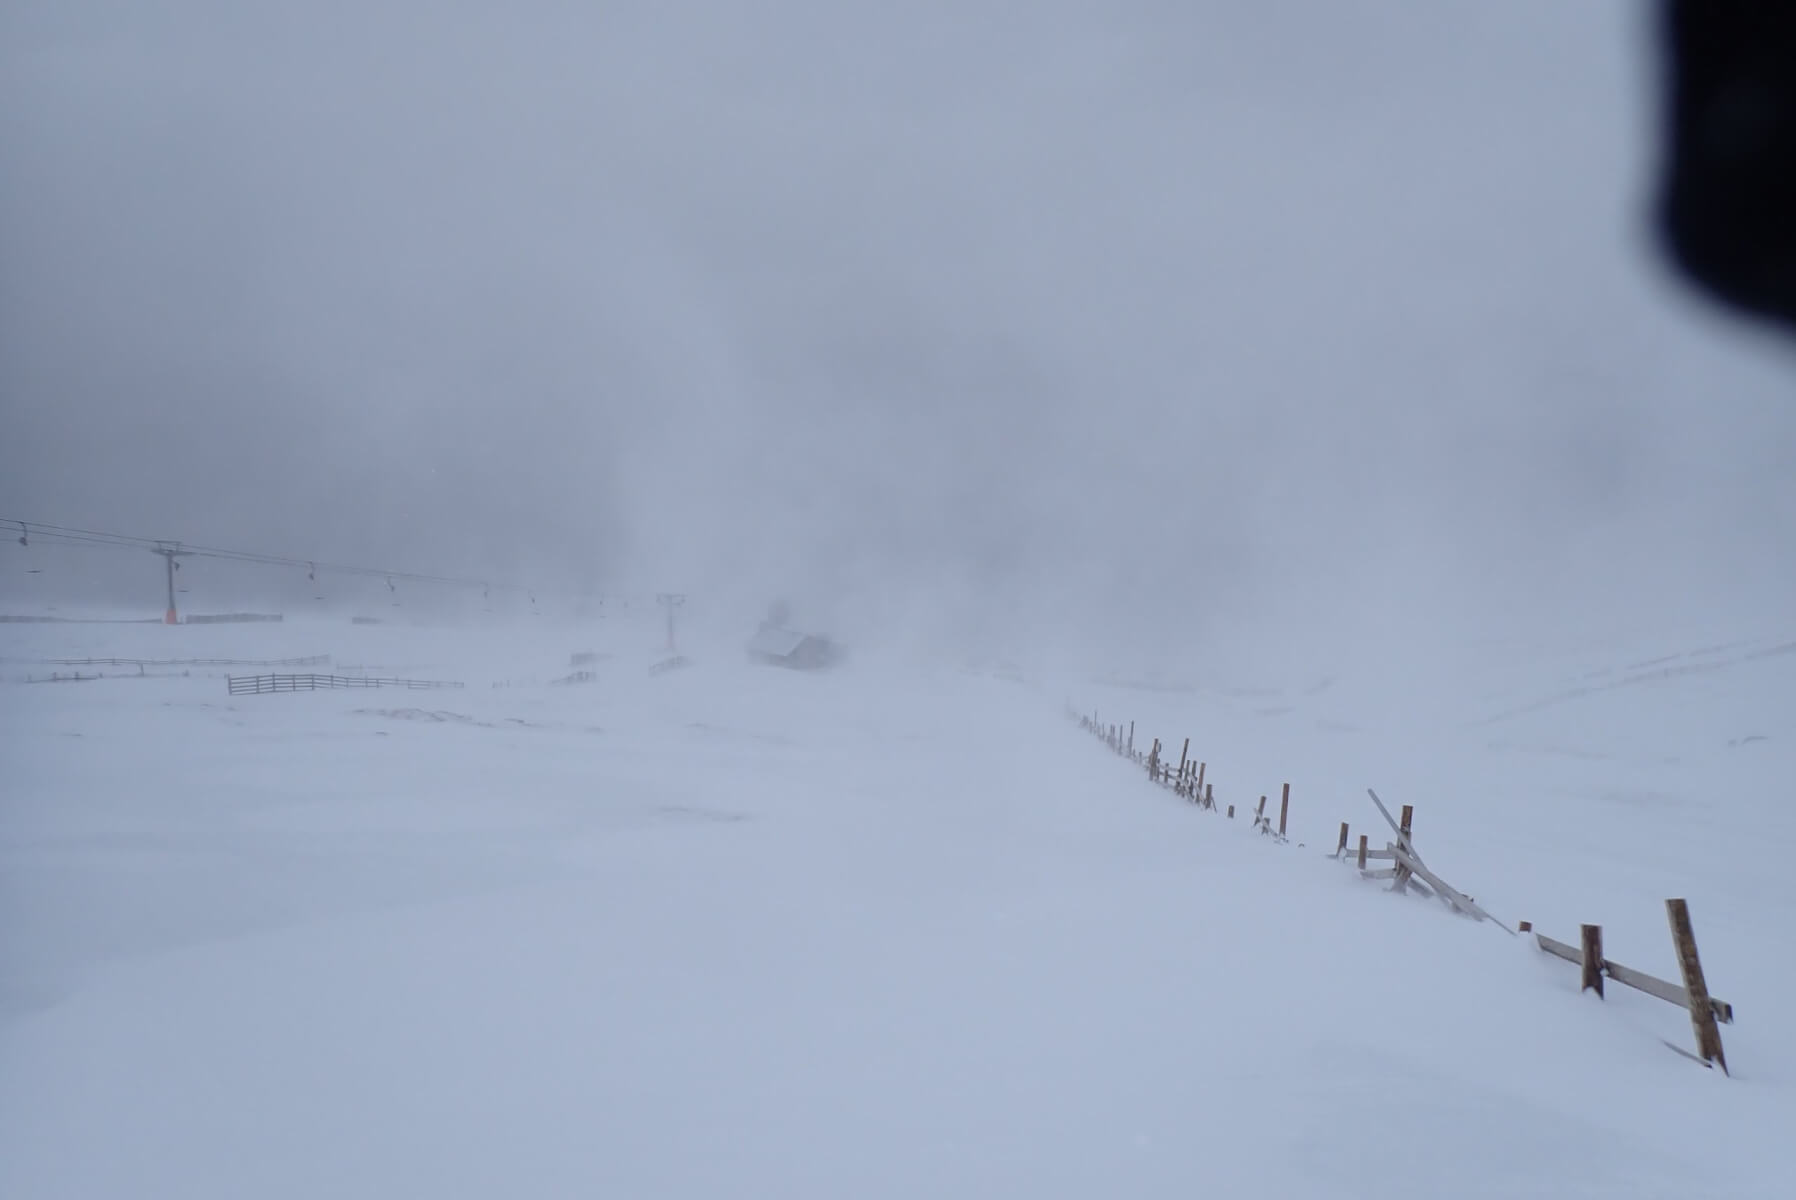
Looking down the bottom section of the Goose. Plumes of snow can be seen blowing around by the snack shack and the bottom of the Goose T-bar.
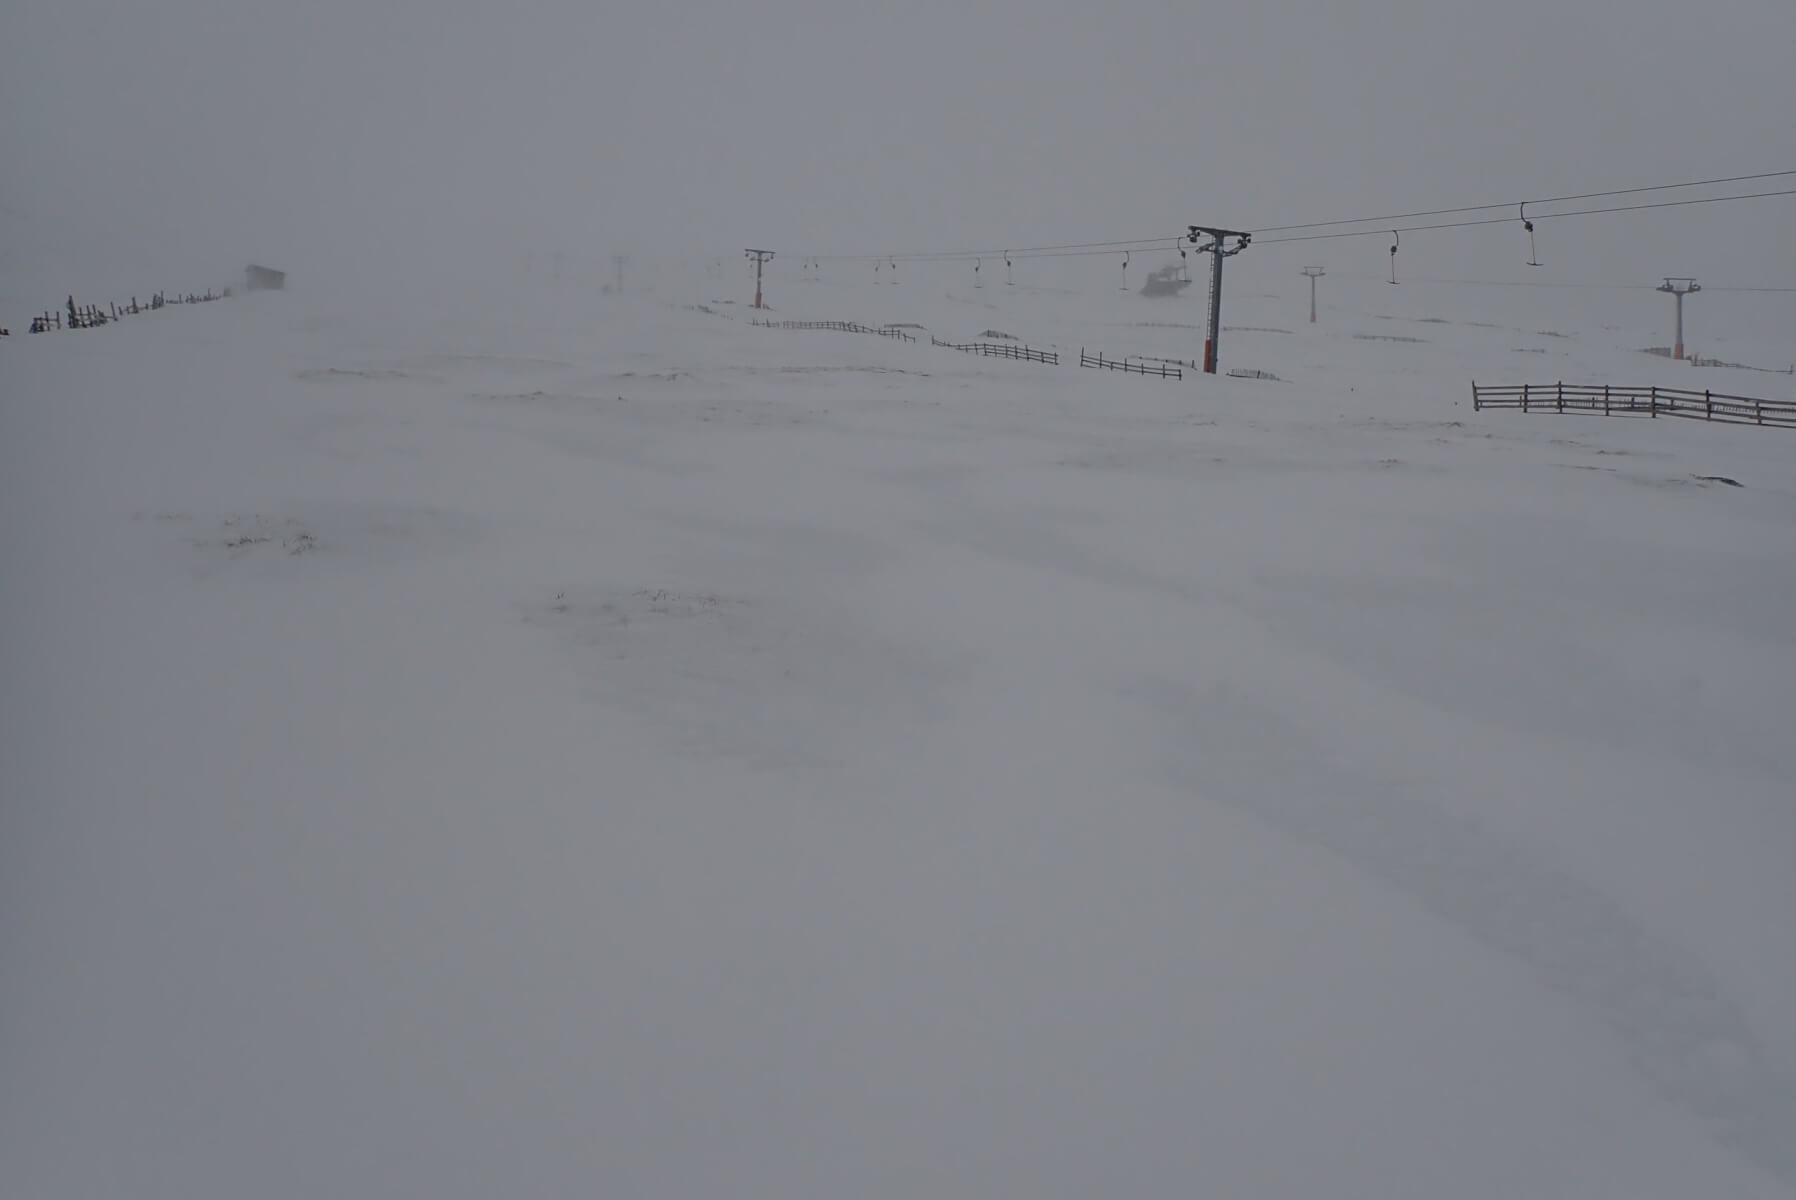
Looking up the Goose. Some shallow areas of fresh, soft windslab while some areas of the old, firm and icy snowpack remain.
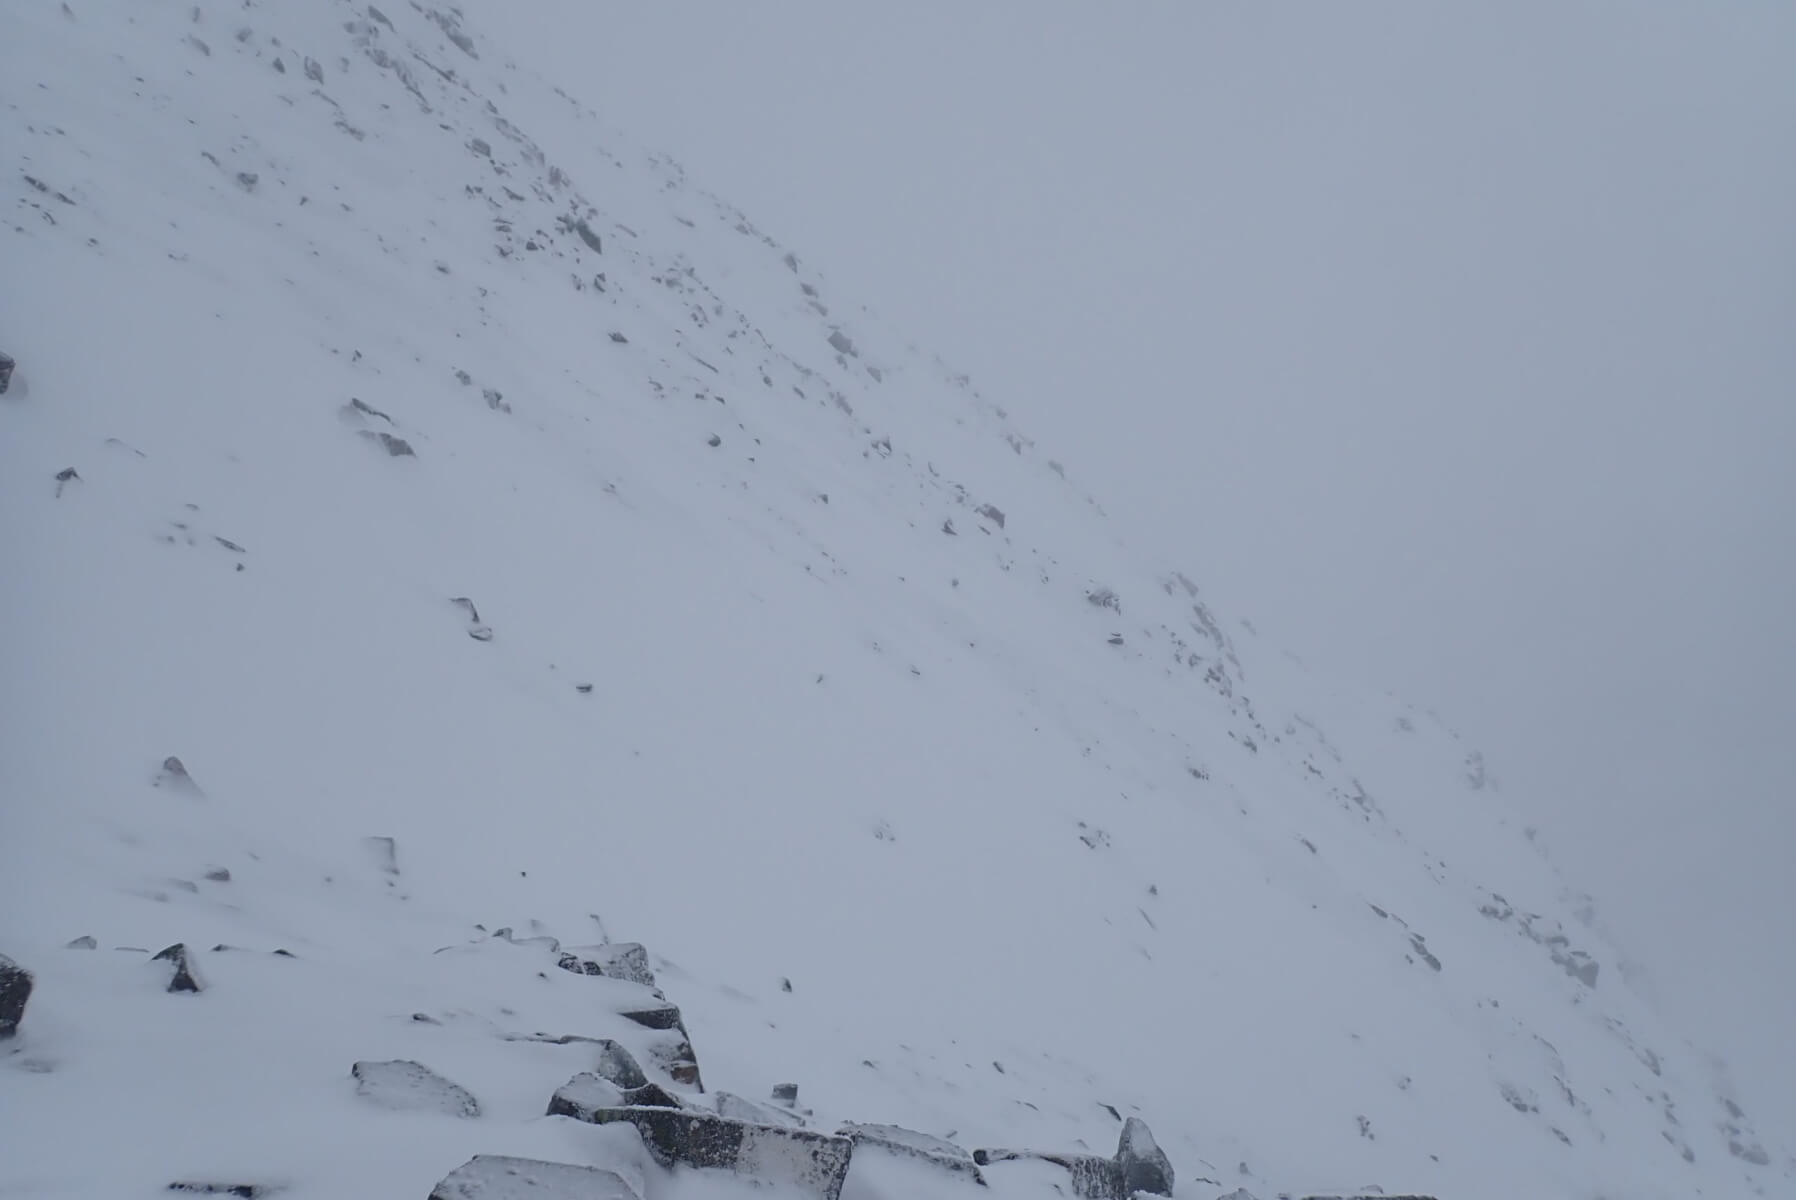
Looking South along the West face of Aonach Mor. Although there are a fair few rocks poking through, the gully lines on this face would likely be catching the fresh snow.
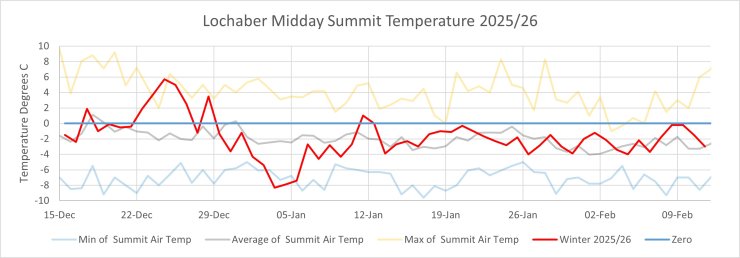
The Aonach Mor summit temperature this season compared to the maximum, average, and minimum temperatures for those dates for all the previous seasons that I have data for (2007-2025). There was a mild spell on the summits at Christmas. However, this was a bit unusual as it was only mild on the summits, there was a very strong temperature inversion and it was cold and frost down in the Glens during that spell. There was also a cold few days in early January. For the past month or so the temperature has been relatively consistent and close to average. Since New year there has only been one day where (at midday) it has been convincingly above freezing on the summits (11th of January).
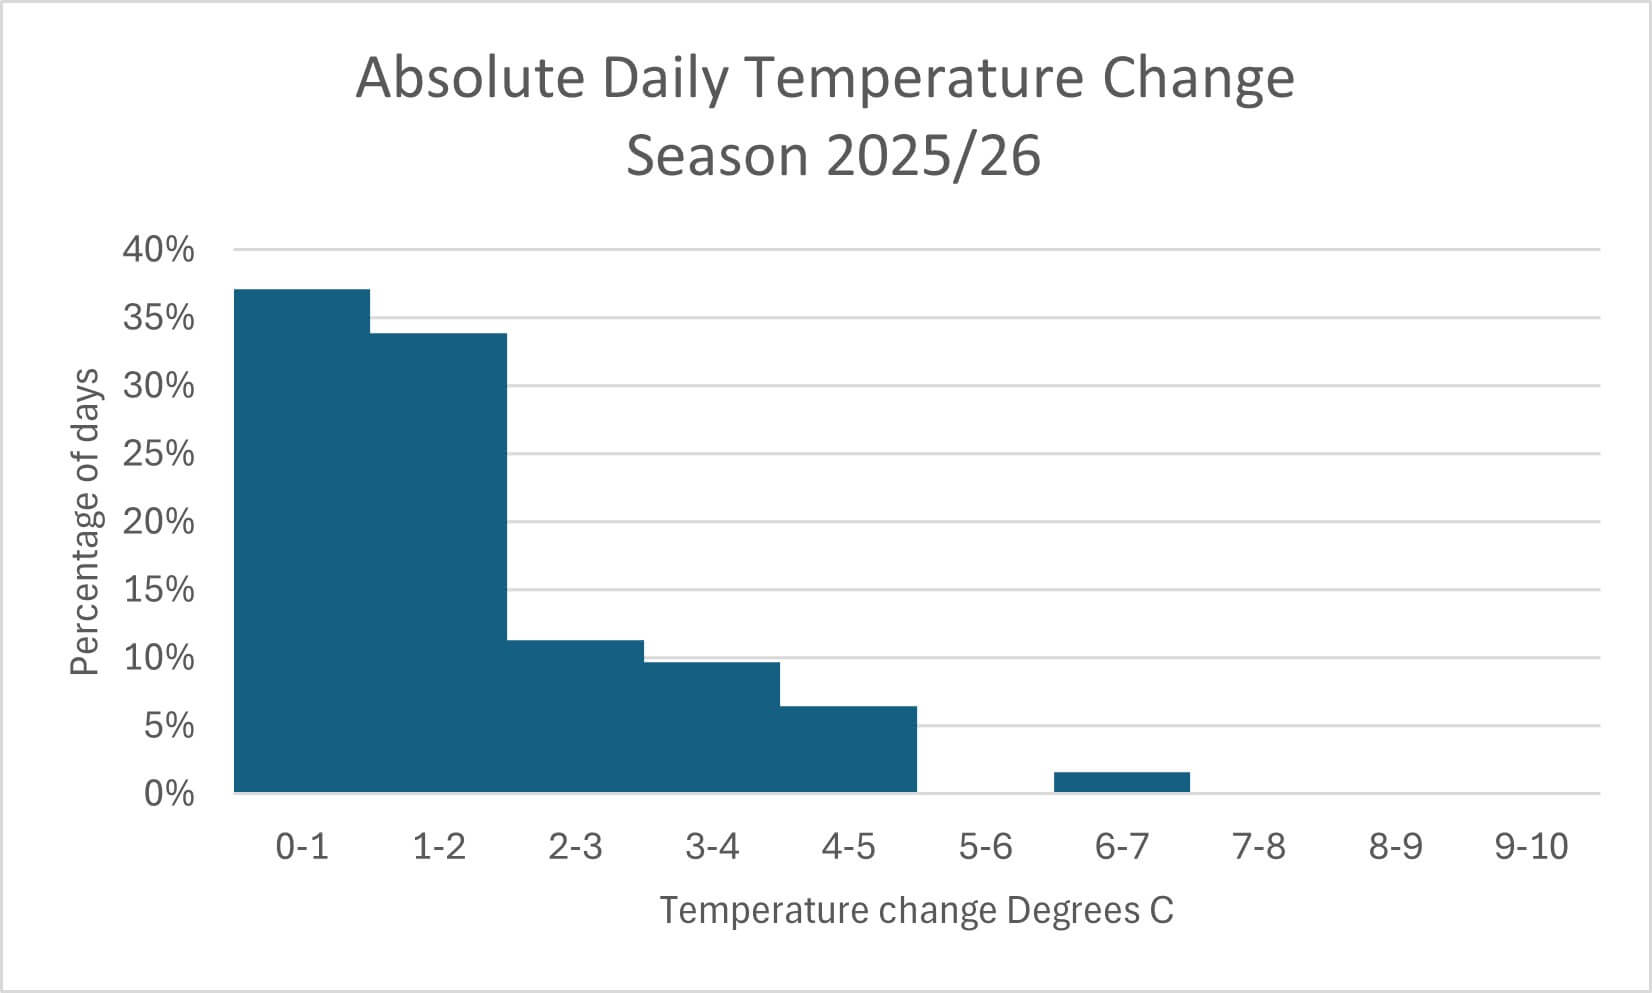
This season has felt more consistent temperature wise than previous seasons. However, feelings can be deceptive so I decided to have a look at actual data. The graph above shows absolute temperature change of the Aonach Mor summit temperature for the 62 or so days since forecasting started this season. In just over 35% of days the change was a degree or less, and in just under 35% of days the change was between 1 and 2 degrees This gives a total of 71% of days when the temperature change was less than 2 degrees, and thus 29% of days when it was more than 2 degrees. Only 1 day had more than a 5 degree temperature change. The equivalent graph for combined data from previous seasons is shown below. On average on only 59% of days the change was less than 2 degrees, and 41% of days when it was greater. So in summary this winter has been more consistent temperature wise.
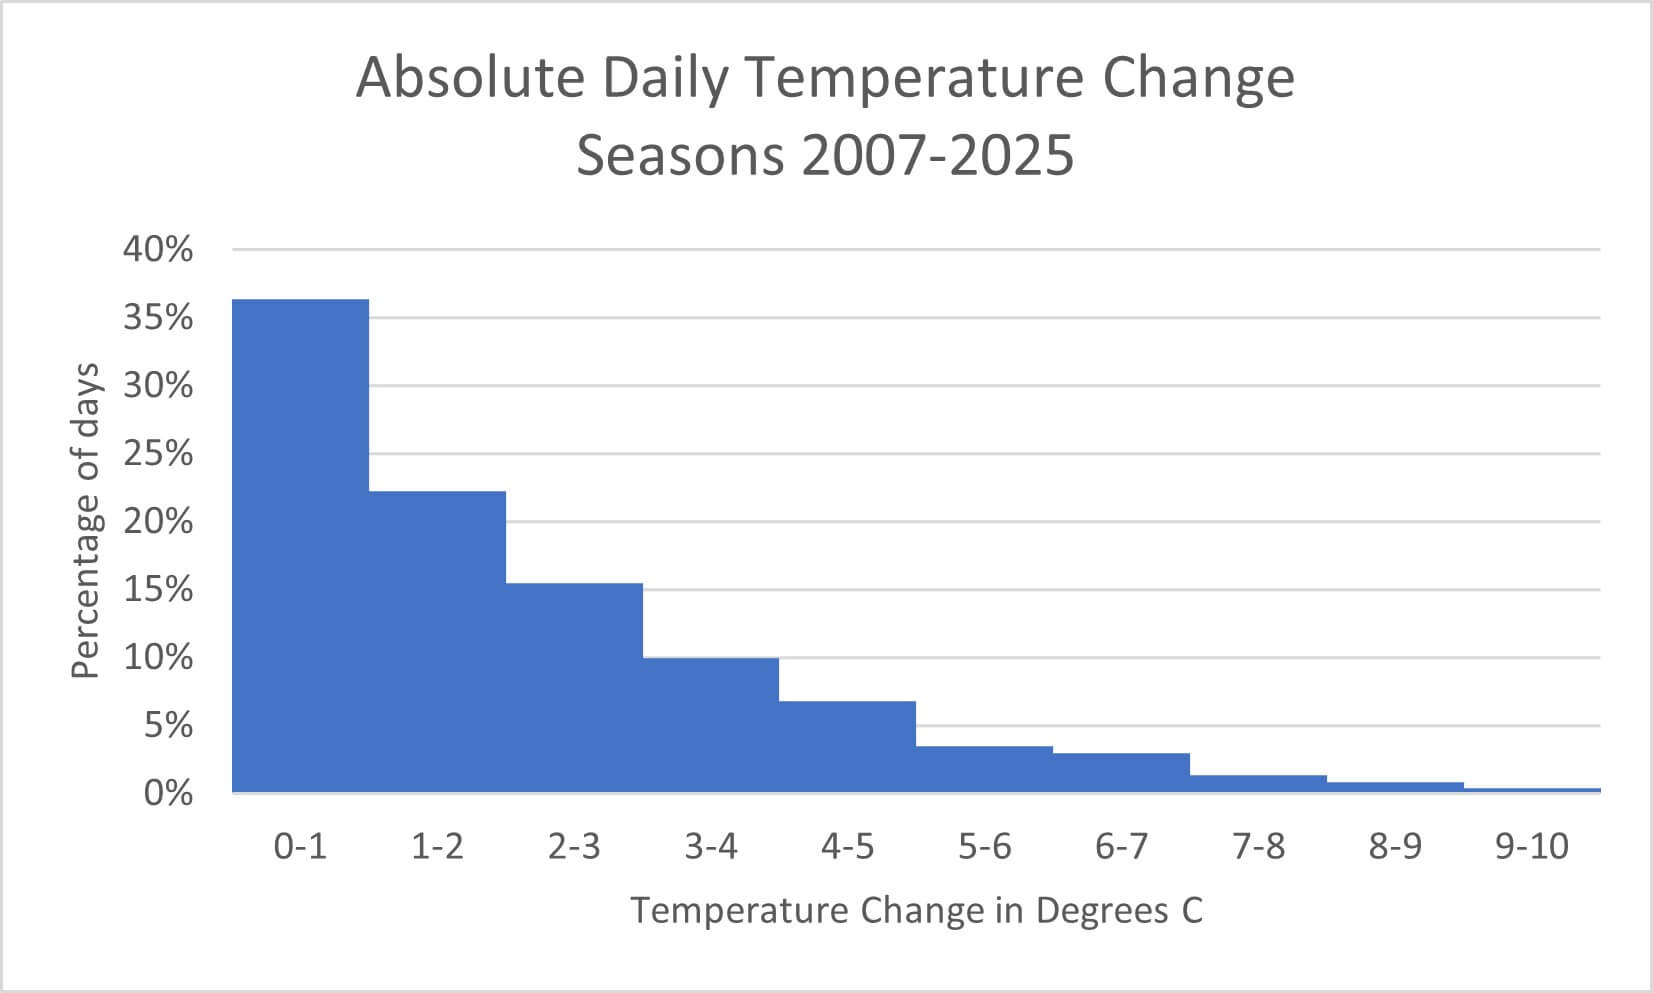
The frequency of the absolute daily Aonach Mor summit temperature changes for all seasons from the 2007/08 season until the end of 2024/25 season. There are a few days with a temperature change of over 10 degrees Celsius but these are so few you can’t see them on the chart, so I stopped the chart at changes of 9-10C. Plotting the graph with a logarithmic scale on the Y axis, the data appears to fall in a straight line, which implies an exponential decrease in frequency with increased daily temperature change. Interesting, if you are interested in that kind of thing.
Comments on this post
Got something to say? Leave a comment


Colin
11th February 2026 6:30 pm
Nice work. Interesting stuff
lochaberadmin
11th February 2026 7:31 pm
Glad you enjoyed it. Have a few more weather graphs in the planning stage….