Out and About on Ben Nevis
9th March 2026
Another relatively benign day in Lochaber today with the freezing level again fluctuating around the higher summits. The snowpack is now well consolidated throughout. There were fair few climbers out, and there looks to be a reasonable amount of ice surviving at higher levels on Ben Nevis. However, I don’t know anything about the quality of that ice.
Some photos to show conditions below, and then a few temperature graphs and tables looking at the January and February temperature.
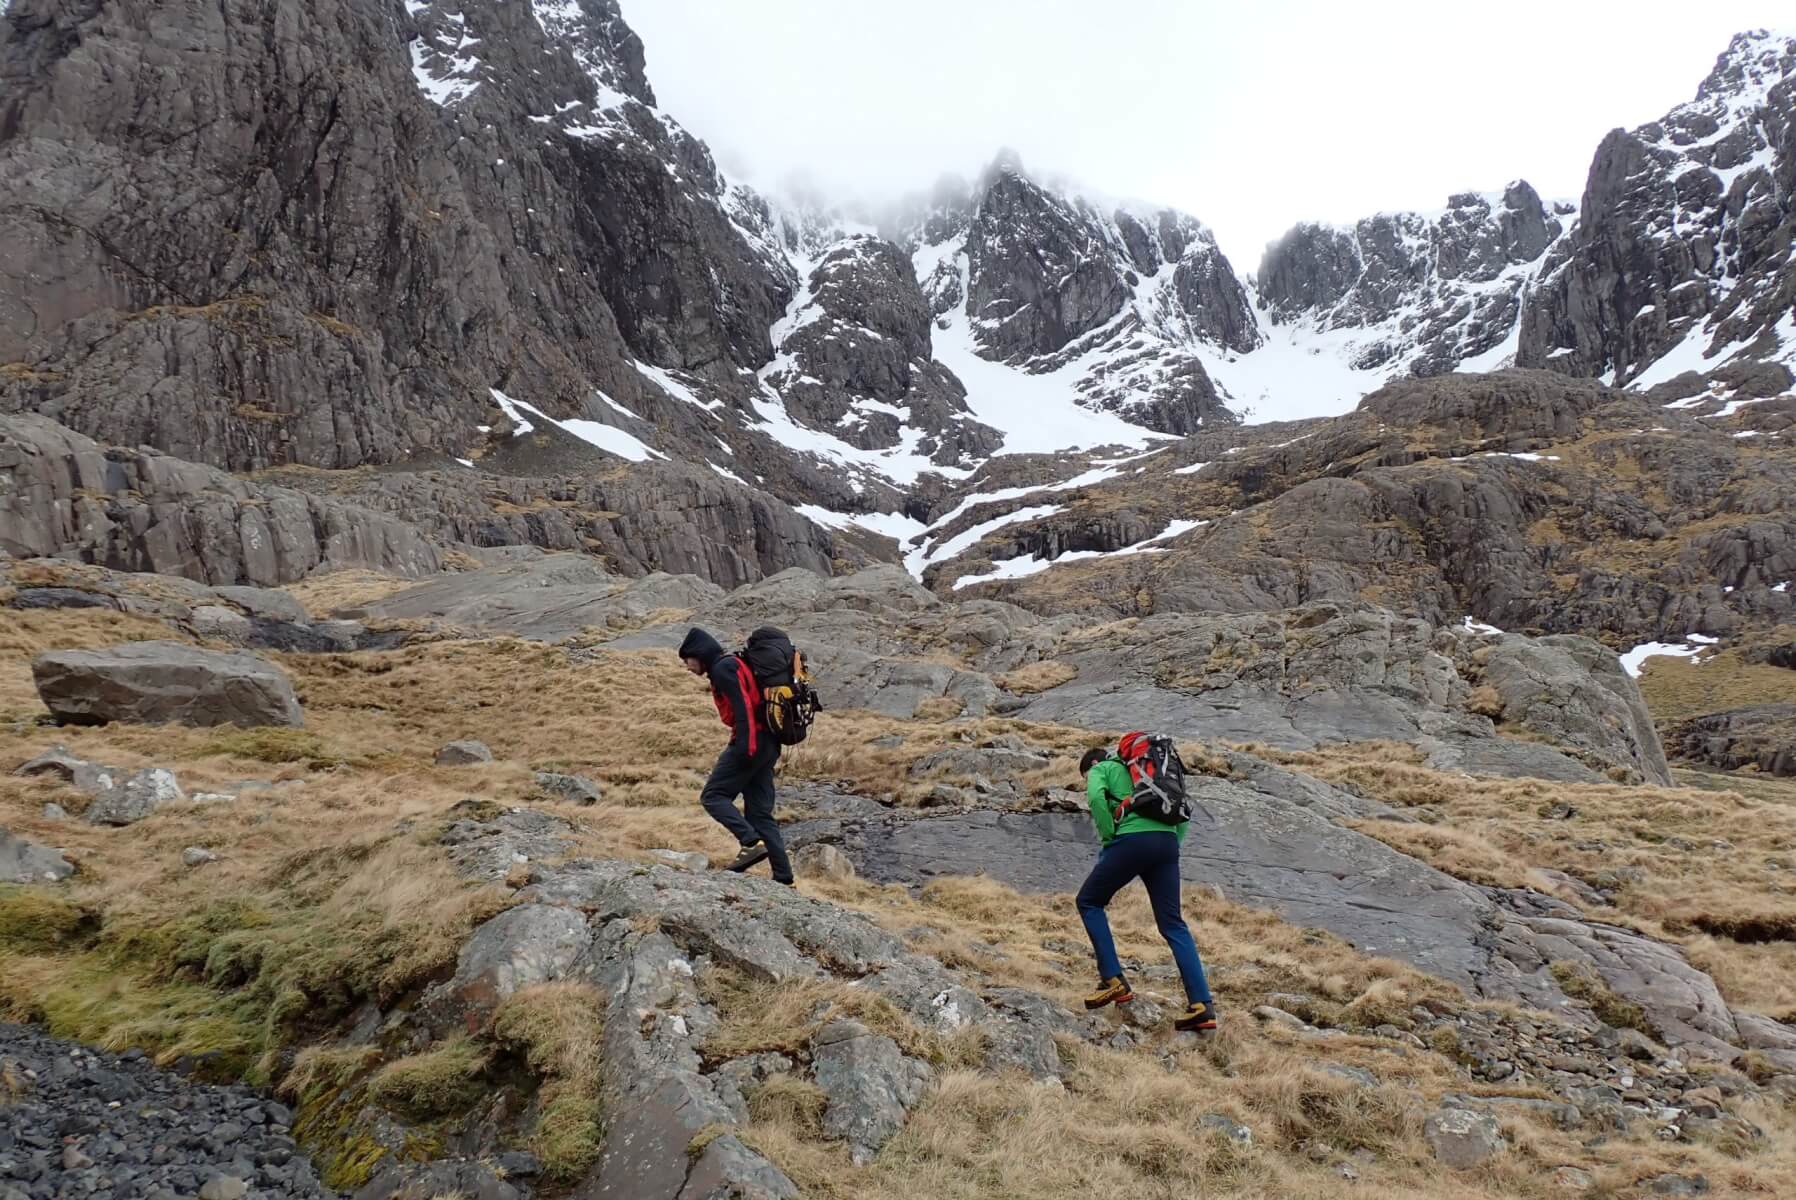
Two cheery climbers to whom I was chatting on the walk in. There were a good number of climbers out today which is good to see. I don’t have any numbers, but it feels like there have been more people out climbing and mountaineering this season as compared to the previous couple of seasons. Conditions have been better this season, so it makes sense that more people have been getting out.
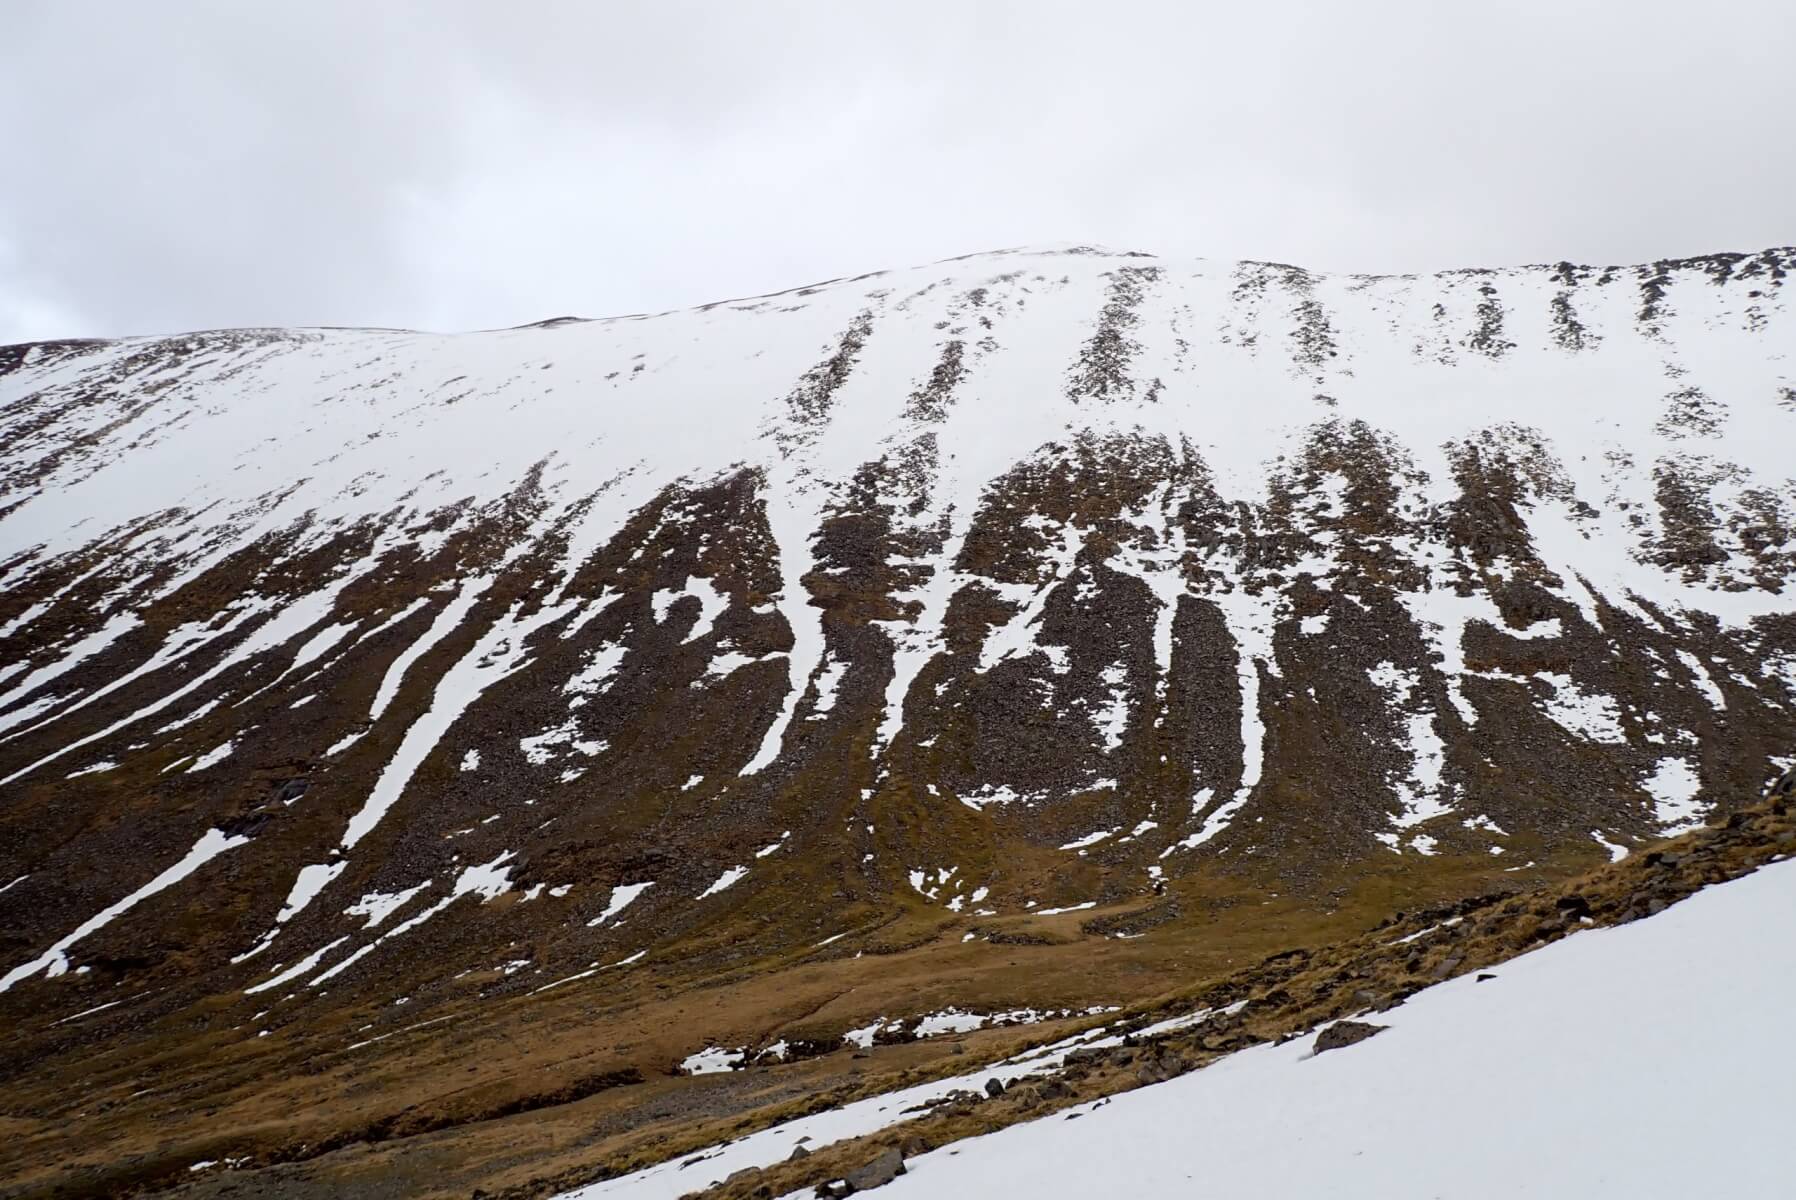
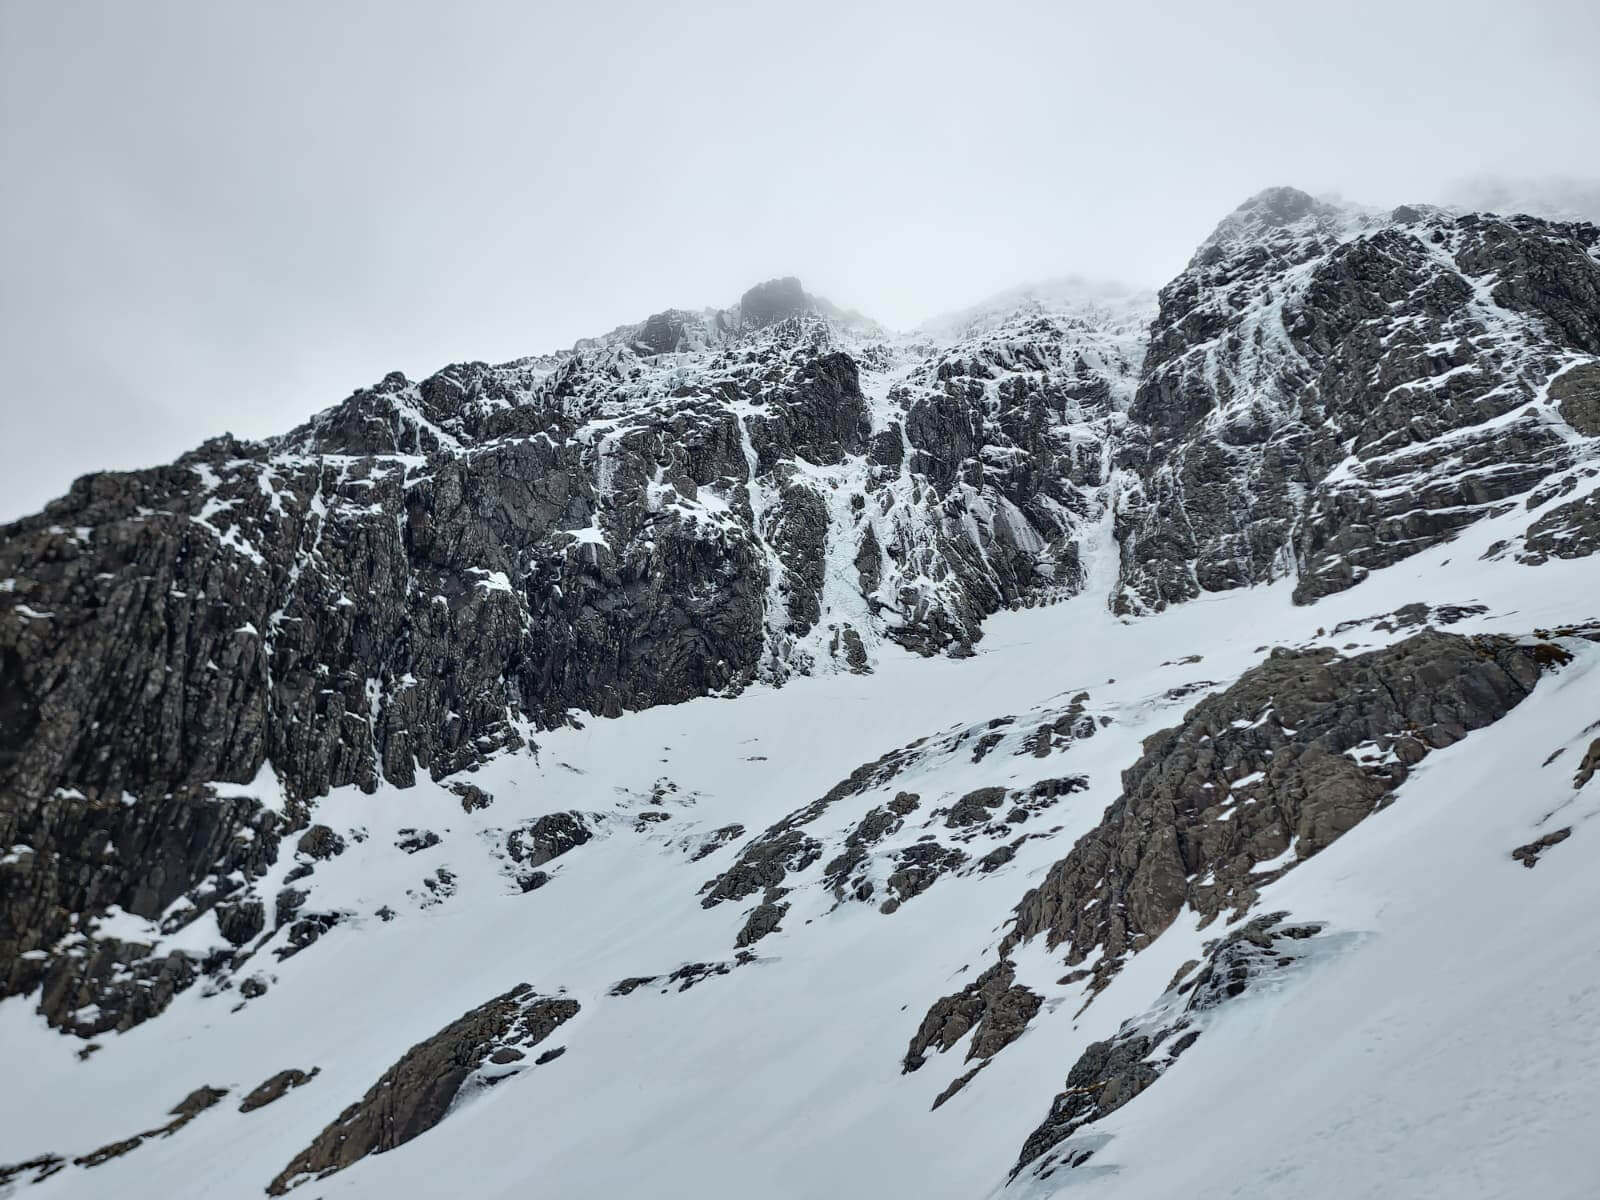
Looking over to Carn Mor Dearg. The South-East winds earlier in the winter filled in the West face. However, the snowpack has been retreating in the mild conditions of late.
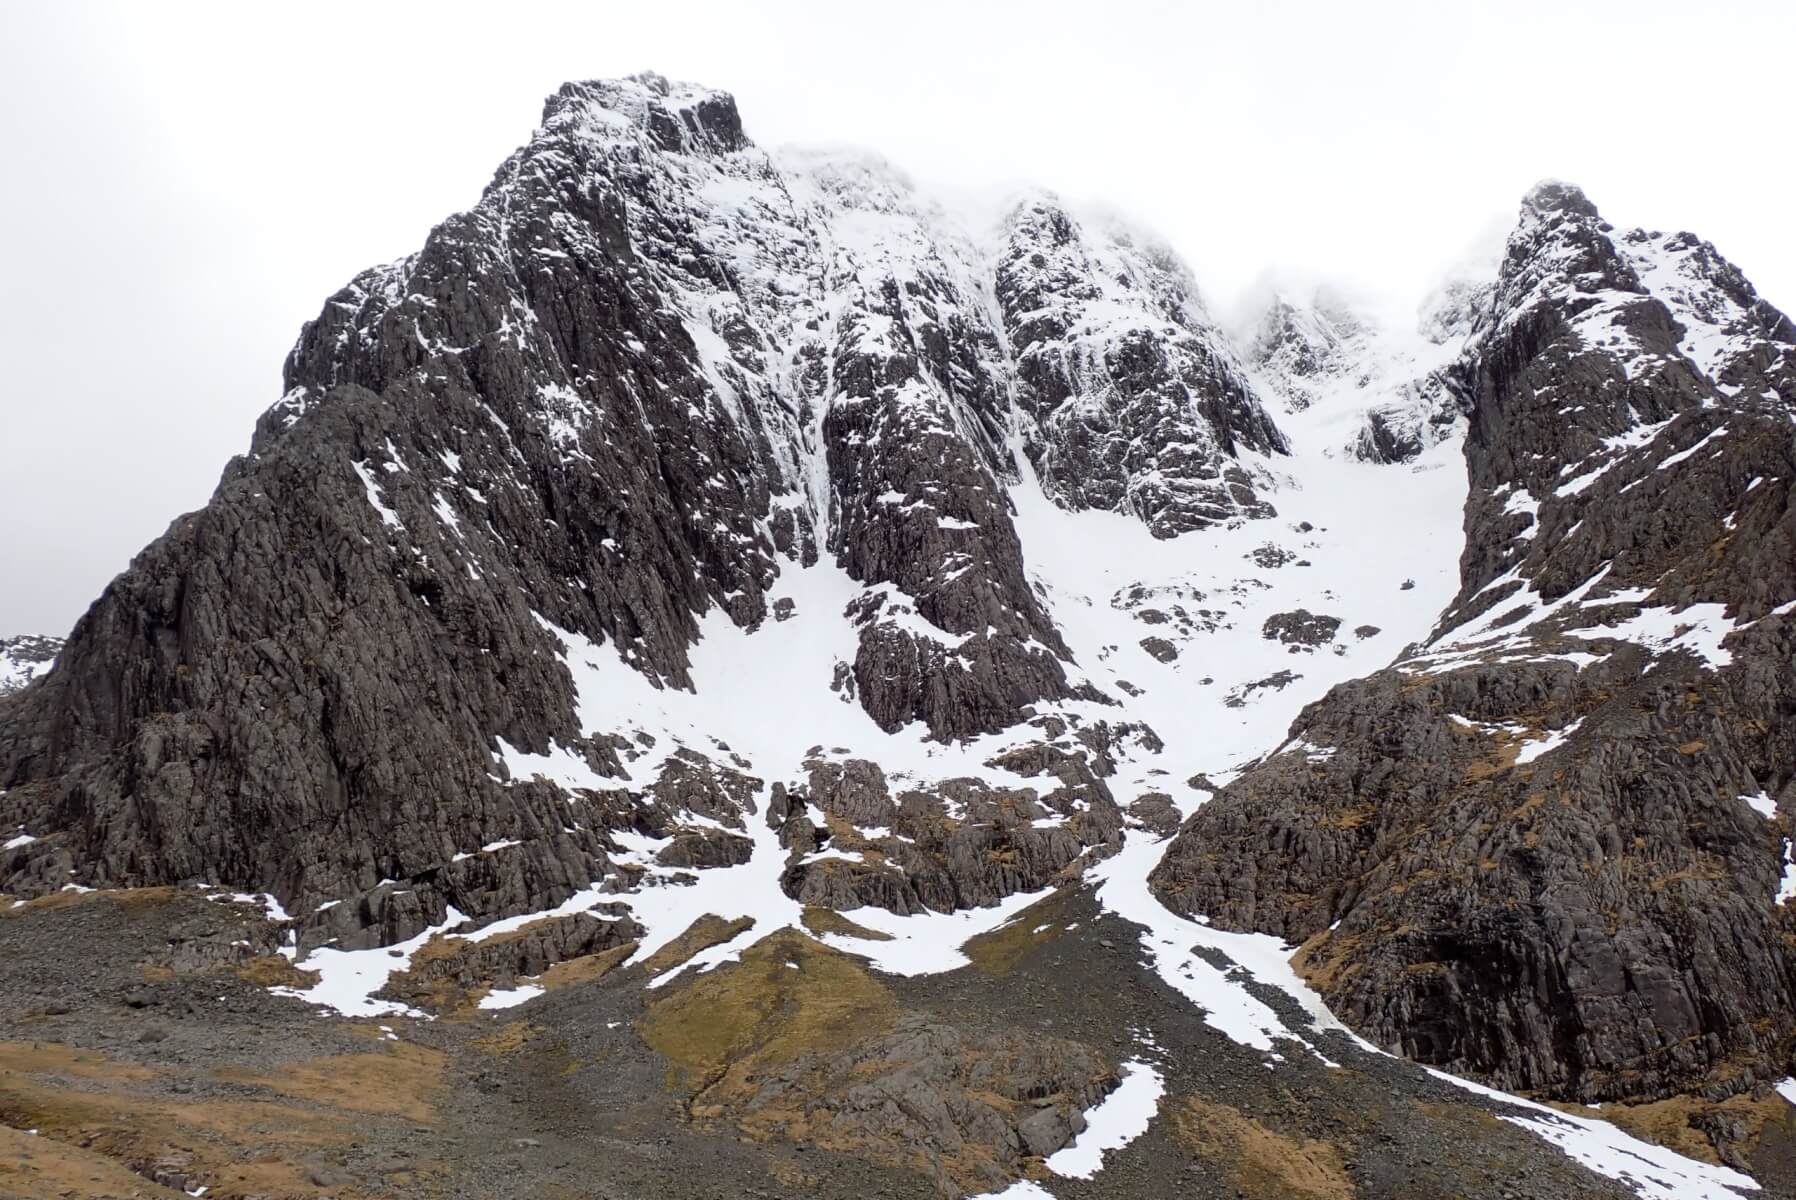
North-East Buttress to Tower Ridge.
Looking up Observatory Gully. A couple of climber can be seen on Point Five Gully if you know where to look; one person belaying at the base of the second pitch, and another about 10 metres above that.
The Hadrian’s Wall/Point Five Gully area. Thanks to Tom Lawfield for the photo.
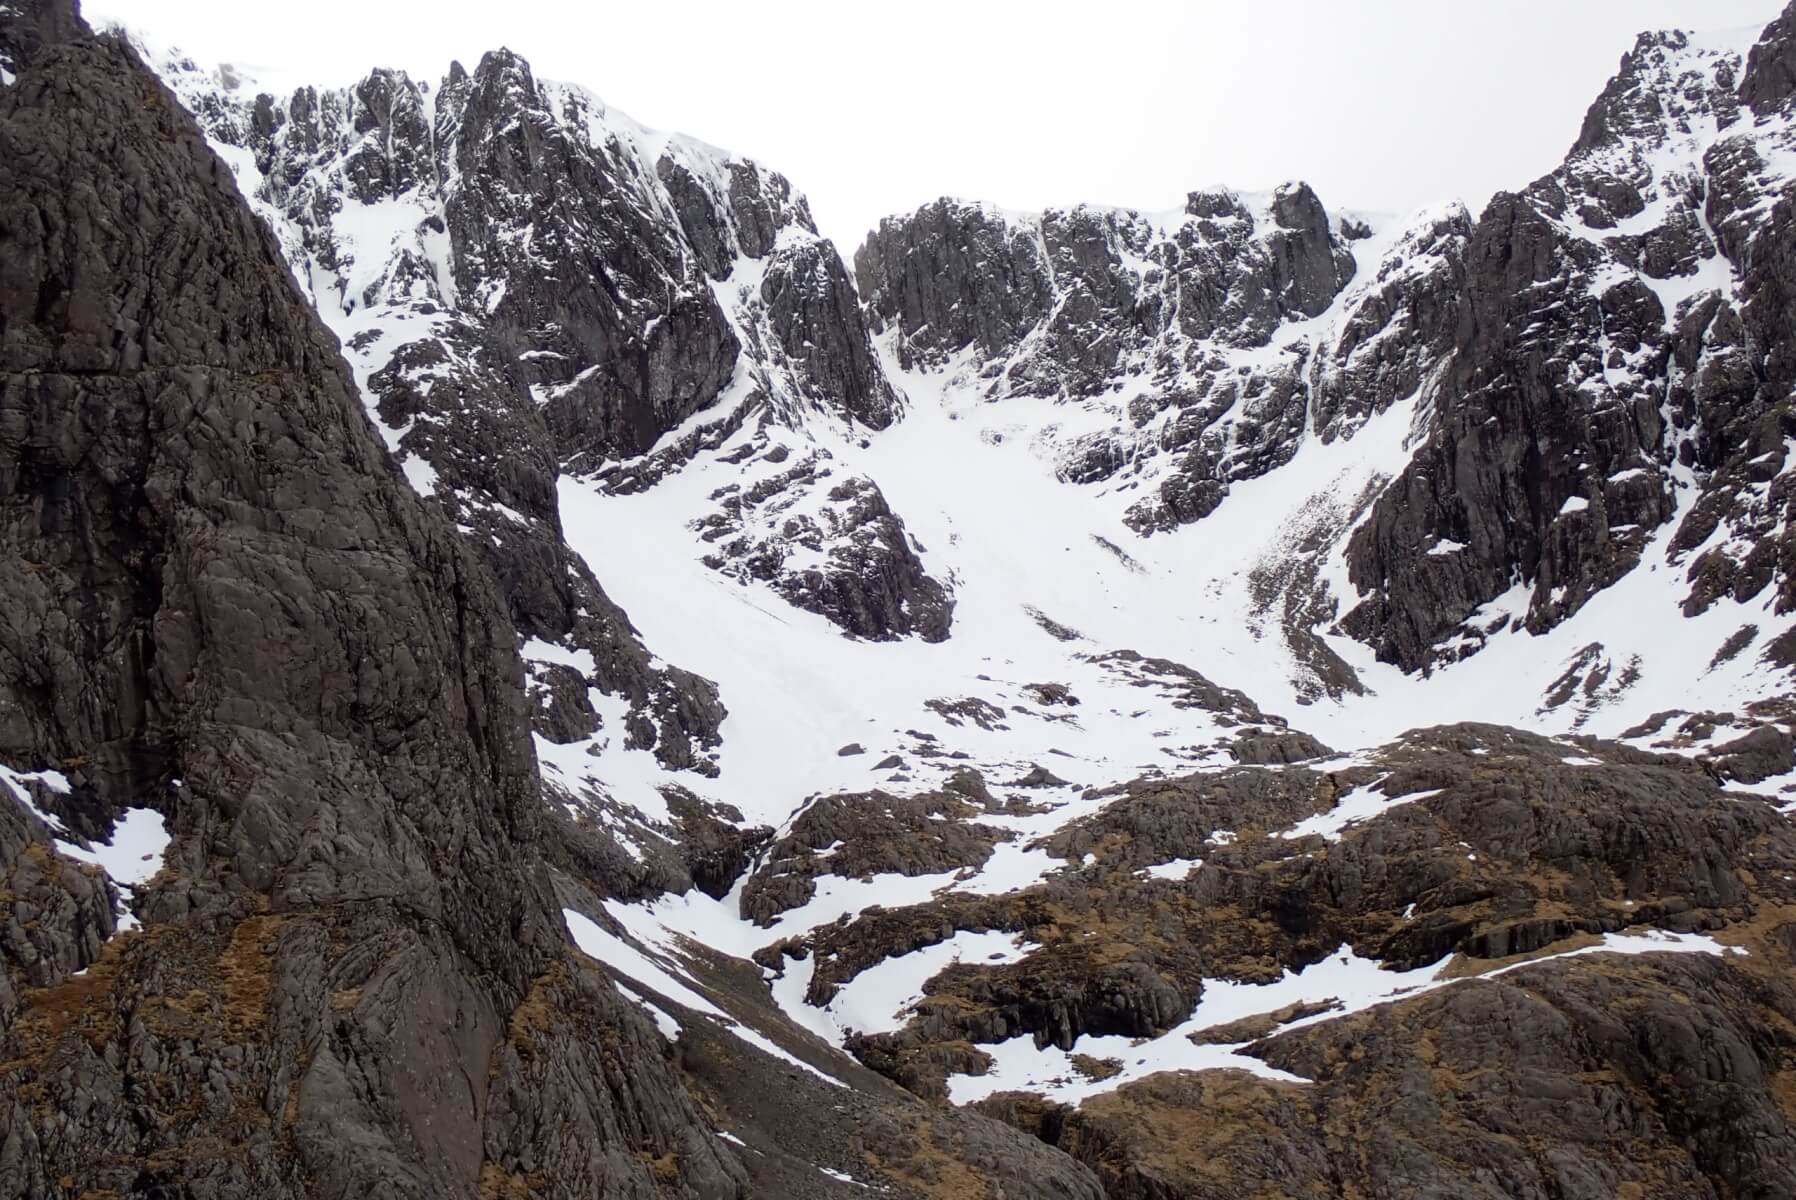
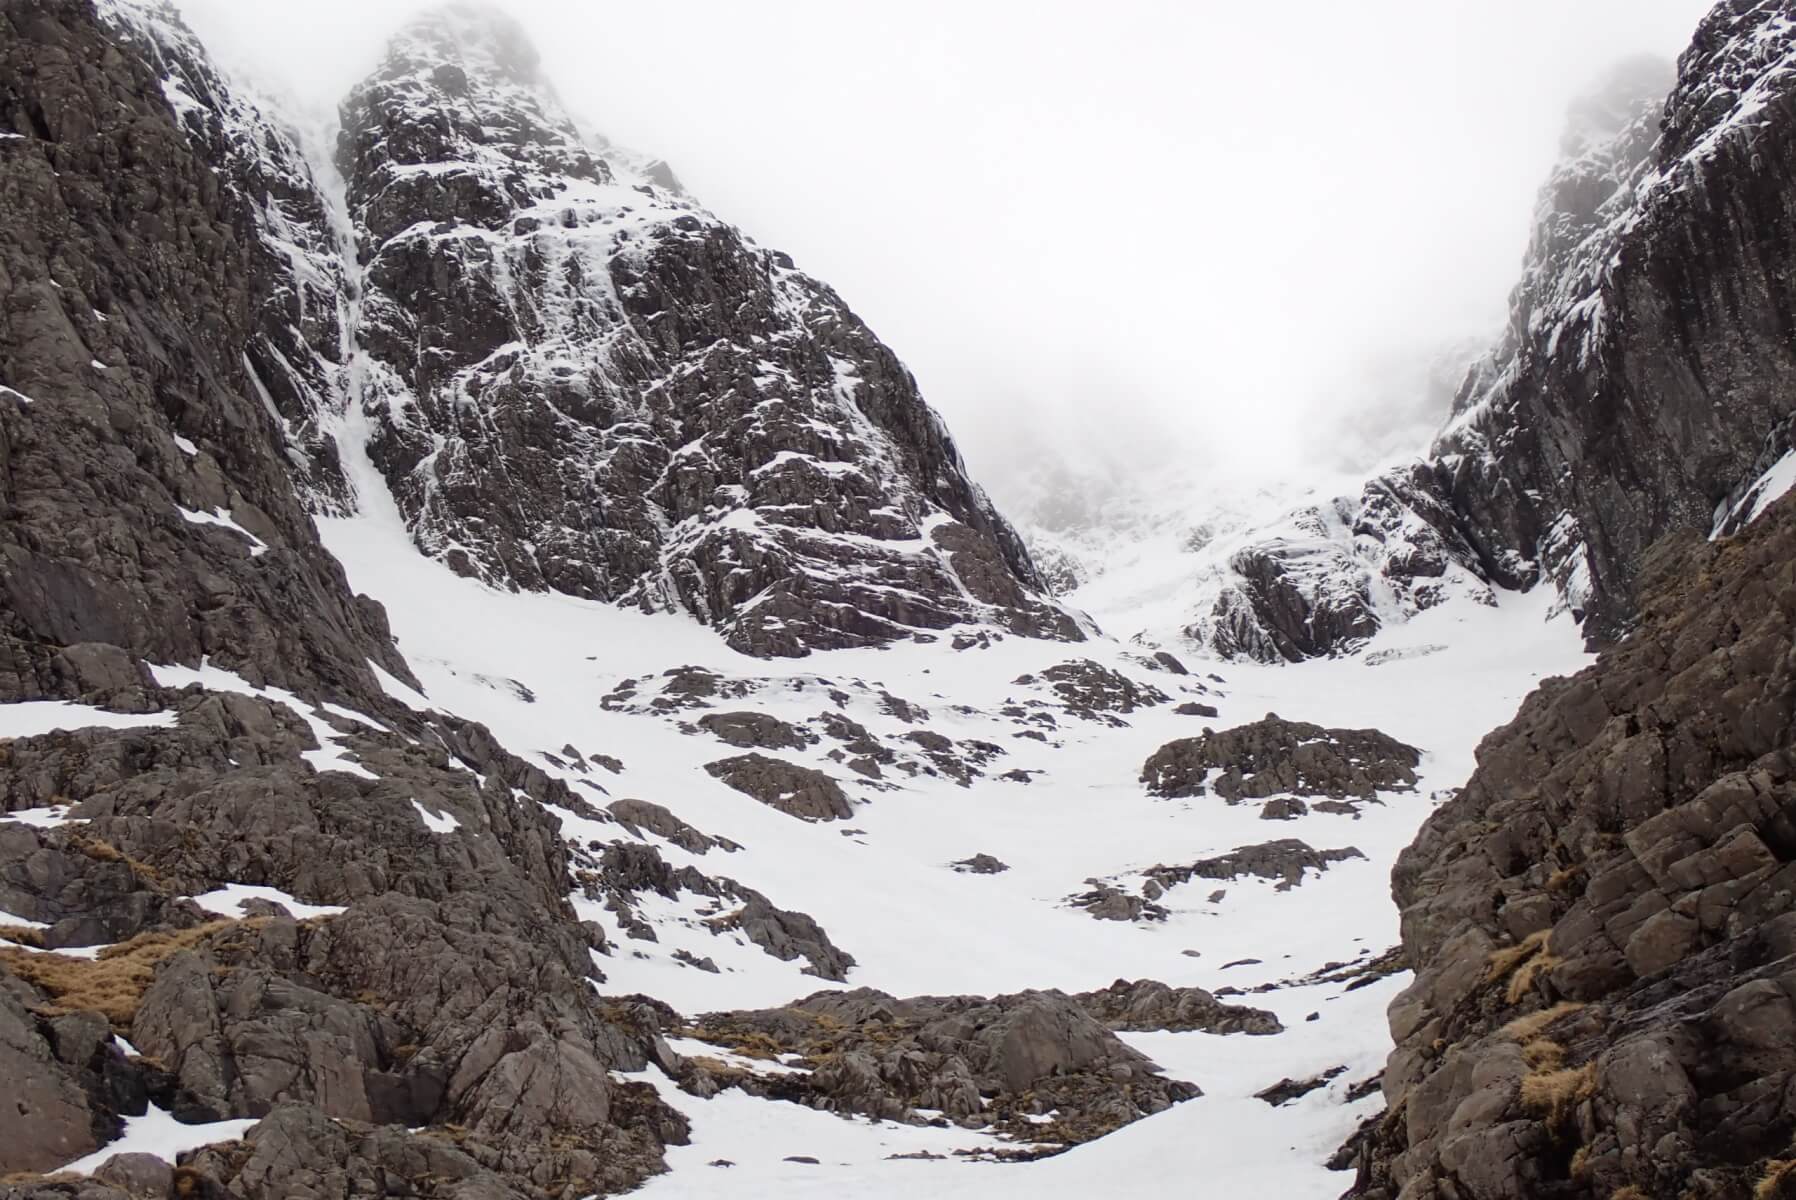
Looking into Coire na Ciste.
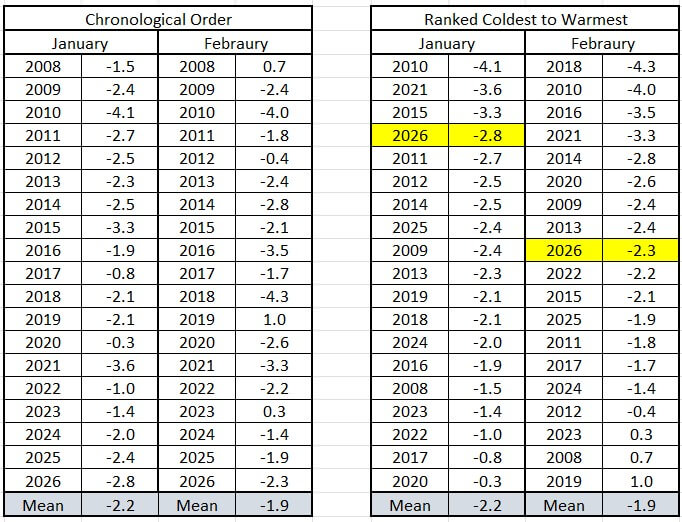
The Aonach Mor Midday Summit Temperature for each January and February since 2008. The left hand chart shows the data ordered chronologically, the right hand chart shows it ranked coldest to warmest with this year marked in yellow. This January was 4th coldest out of those 19 years, and February the 9th coldest. They were 0.6°C and 0.4°C below the mean for January and February respectively.
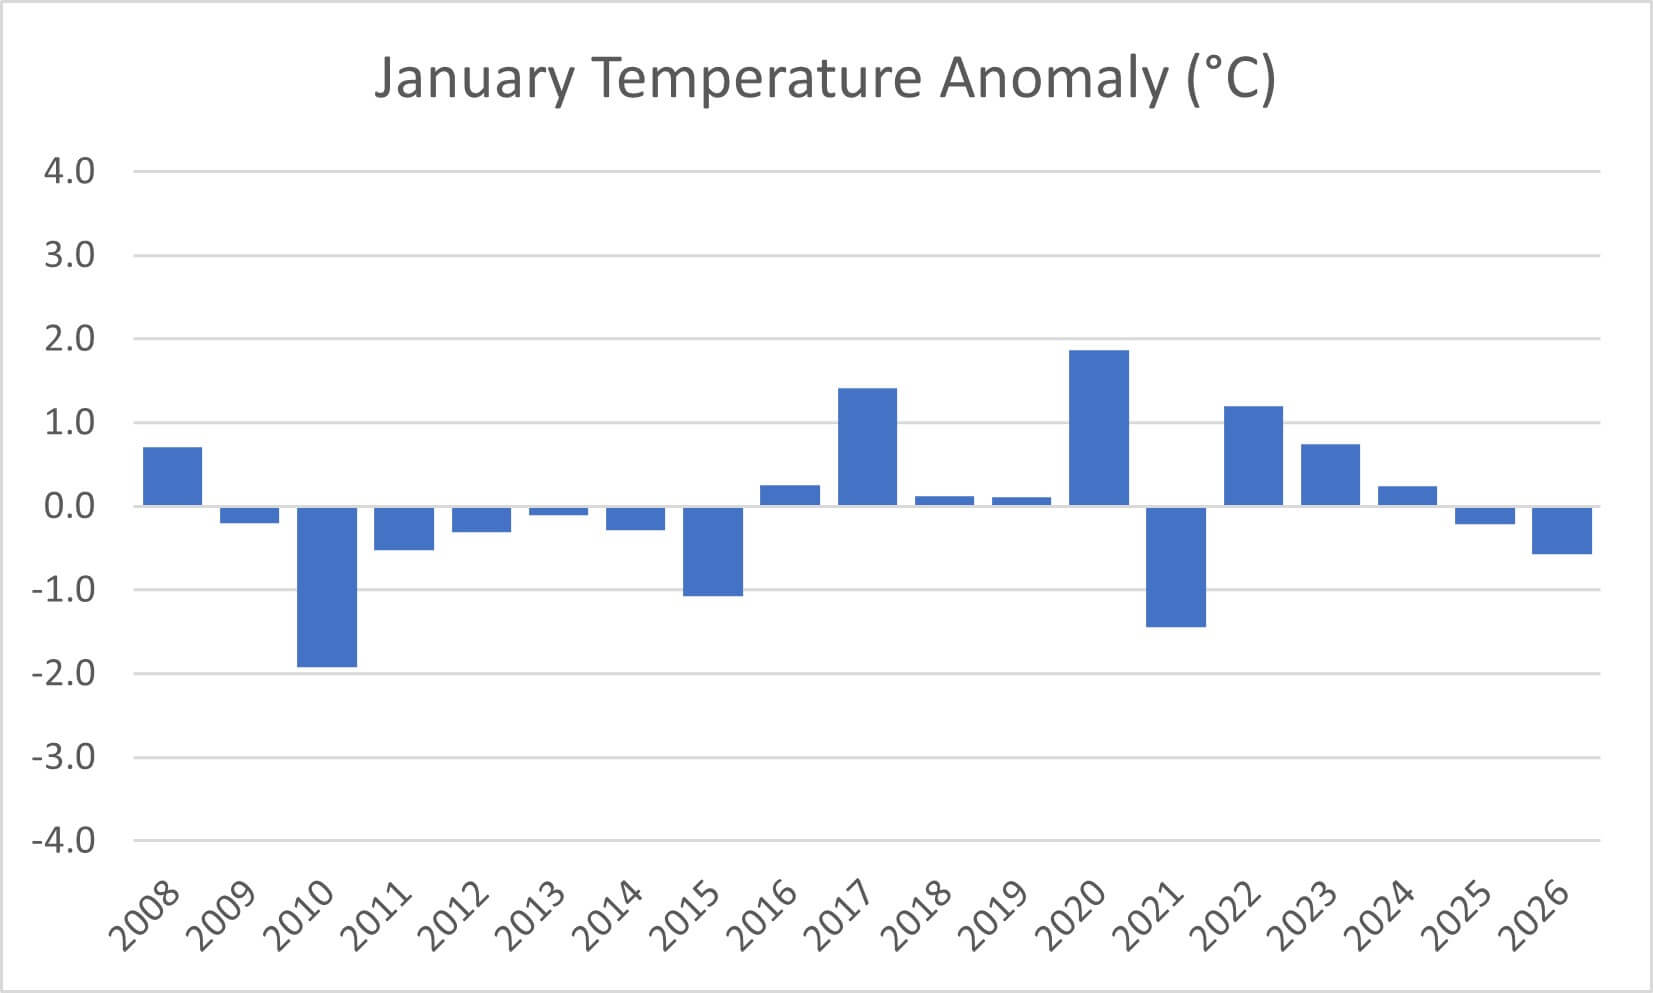
The January Aonach Mor midday summit temperature anomaly. This year had a small negative anomaly. The cold Januarys of 2010 and 2021 and warm January of 2020 stick out. Interestingly, no January in this time has had an anomaly of ±2°C or greater
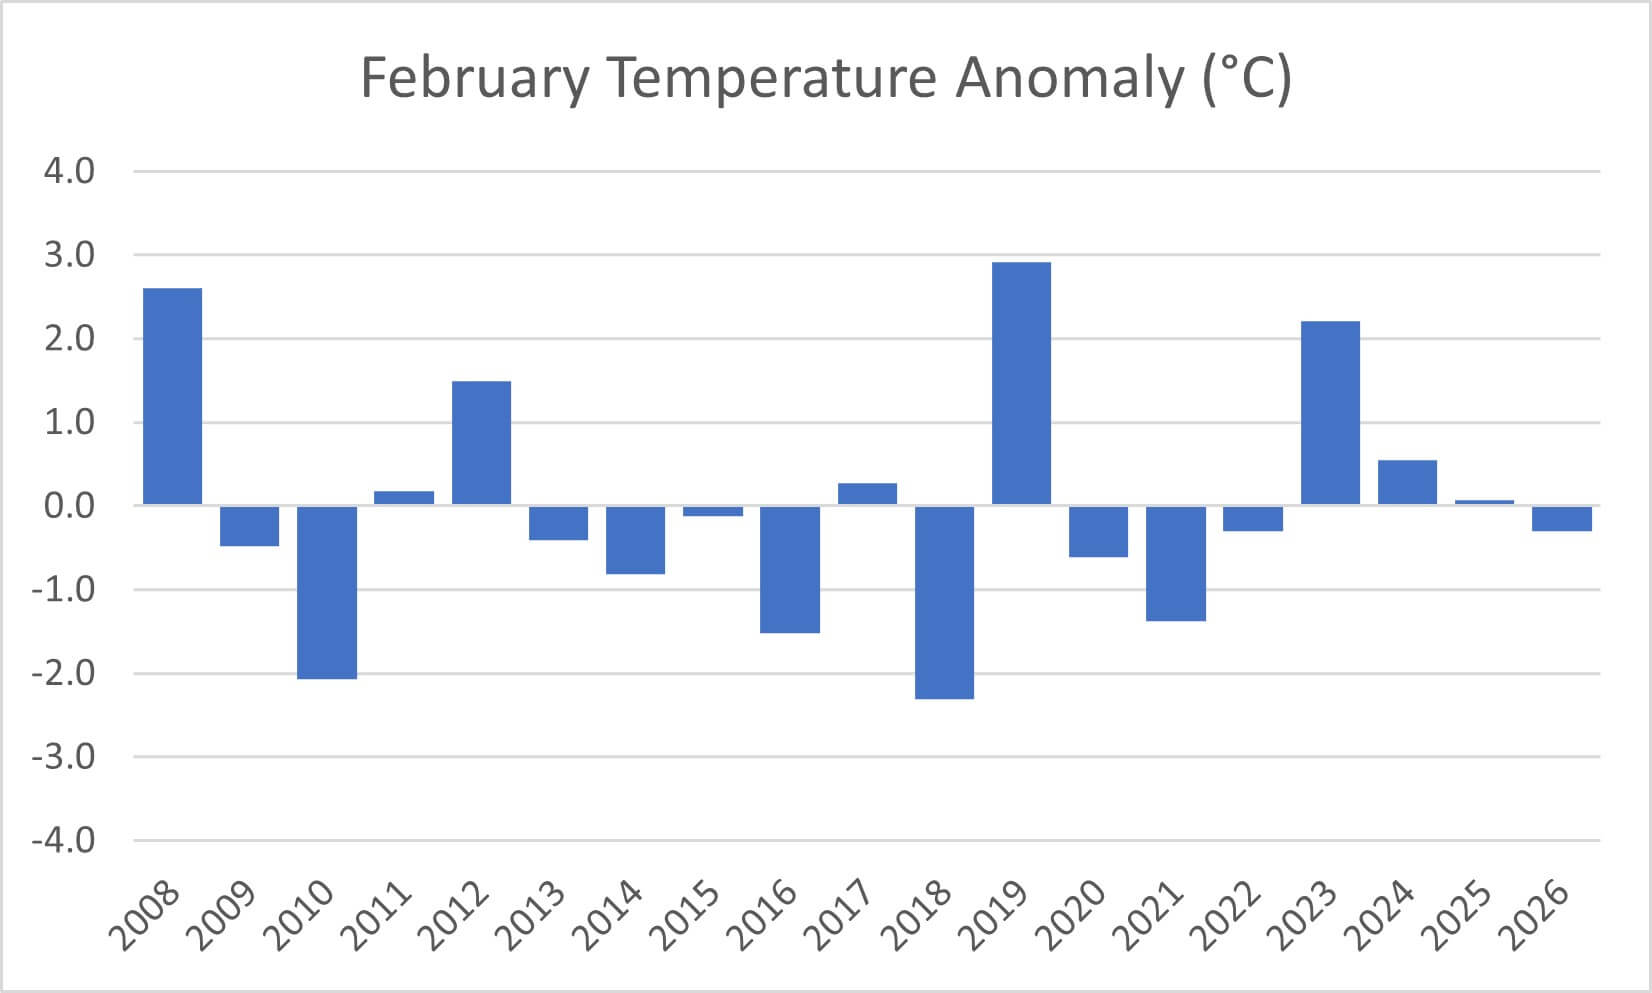
The temperature anomaly for February for the last 19 years. This year had a small negative anomaly. Interesting February had 5 years (2008, 2010, 2018, 2019 and 2023) during which the anomaly was greater than ±2°C. During the same period January had no years when the anomaly was that large. In terms of mean monthly temperature February has been a more variable month than January. I am not sure the reason for this, or if the day to day temperature change in February is greater than in January. Something else to look into at some point.
Comments on this post
Got something to say? Leave a comment


Mark Figiel
9th March 2026 7:54 pm
Appreciate the hard work you put into the data above, really interesting. It is a pity we couldn’t have snow depth’s ( say Coire an Lochan ) for all those years.
lochaberadmin
10th March 2026 4:48 pm
Glad you enjoy the graphs and charts. Snow depth in Coire an Lochan would be interesting, I do have photos of Coire an Lochan for each season, perhaps a comparison of these would be a good (but potentially long) blog post at some point.
Thomas Thorp
10th March 2026 9:59 am
Good to see you up there Blair and thanks for the photo!
Always appreciate the graphs – keep them coming.
lochaberadmin
10th March 2026 4:44 pm
Yeah, good to see you as well and hope you had a good climb.
Jonathan Preston
10th March 2026 11:00 am
Very interesting… thanks Blair… fascinating to note that out of the 19 years of temp recordings on Aonach Mor the majority of the years both in Jan and Feb showed a negative anomaly as opposed to a positive one… ie more years when the month was cooler on average than warmer… despite what people may think about the winters getting milder..
lochaberadmin
10th March 2026 4:55 pm
So the mean for the data set is based on those 19 years. As you say there seems to be no clear trend in terms of temperature. However, there is a lot more to a winter than just temperature, despite this January and February so far only being fractionally colder than last January and February, in terms of wintry feel there has been huge difference. I am wondering if I could do some sort of winter quality index for each season based on number of days of snow, or rain and daily temperature.
Clive Hebblethwaite
11th March 2026 12:27 pm
Always interesting to look at these sort of data sets but, as you’ve pointed out, caution is needed with over interpretation from one data set over a limited time period of 19 years.
In terms of quality of winters one metric that would be interesting to look at would be the number of long thaw events, ie back to back days of above zero. I’ve always thought that conditions can usually sort of survive four warm days in succession, five or more and everything takes a massive hit.
I know that this particular type of weather event is an area of research for met office climate scientists but perhaps some SAIS homework for a quieter day?
lochaberadmin
11th March 2026 2:56 pm
That would be interesting, maybe something for a future blog. I do think that it also depends on the amount of rain in the thaw events with warm and dry not being too bad but warm and wet causing much more damage to the snowpack.