End of March Analysis
31st March 2025
It was a mild day to finish off the month. I had hoped for a clear day, and an opportunity to see what remains on Ben Nevis. However, it was not to be. I headed up Aonach Mor again as on claggy days that is the best option to see what is going on at higher levels. The forecast is good for the next few days, so will hopefully get some view of the Ben over the next few days.
The spring snowpack is gently thawing. There are a few sections of cornice about, and these are slumping with some bits prone to collapse in the mild conditions.

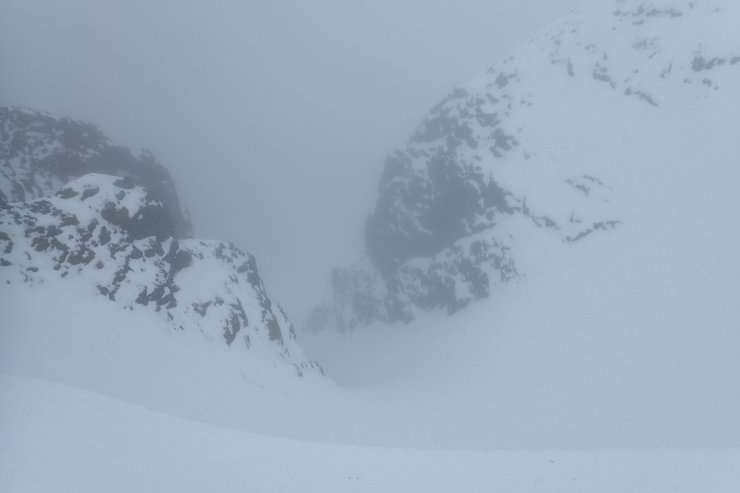
Misty murky conditions on the way up the hill. There were blobs of cloud floating about at different levels, and visibility would change rapidly depending on where the blobs were. Compare this photo to the one below which was taken 5 minutes later.
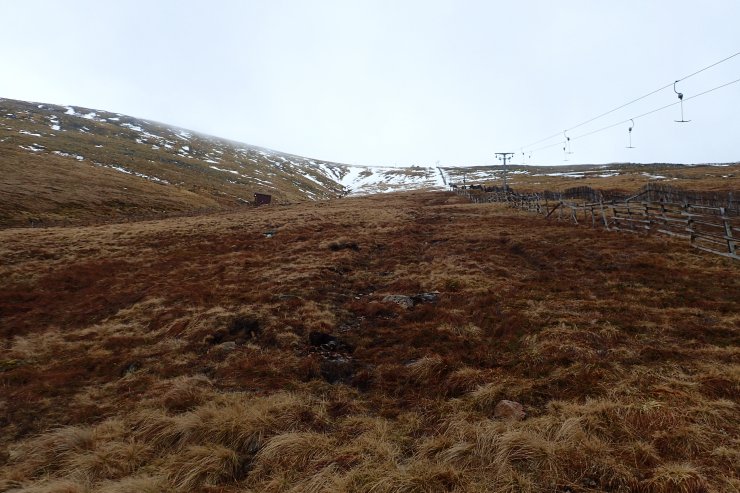
Looking up the Goose about 5 minutes after the previous photo was taken. This was about as clear as it got all morning.
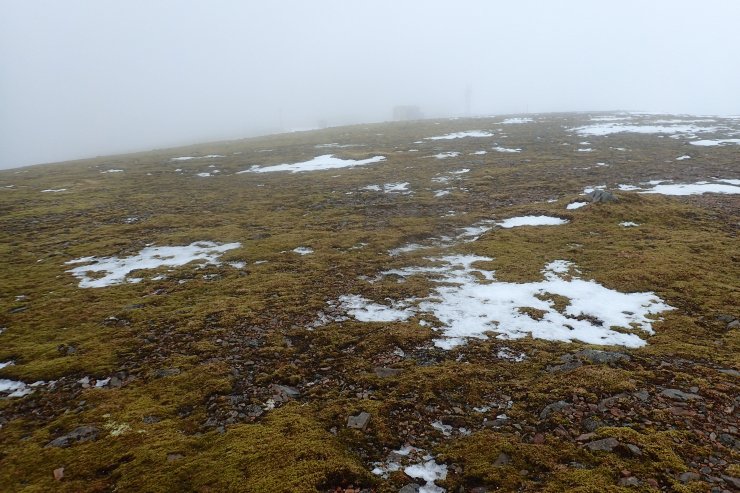
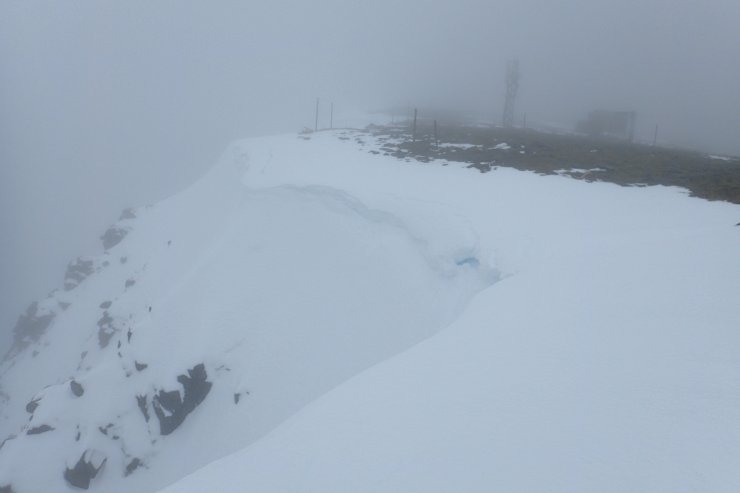
The view across the plateau from near the top of Easy Gully. There is not much snow left on the plateau.

There is a bit of cornice slumping going on. However, I suspect thing will general settled and stabilise with just small sections here and there falling off rather than any large and substantial failure.
As promised in yesterday’s blog, some analysis of the Aonach Mor midday summit temperature is given below. In summary January and February were close to average temperature wise while March has been mild this year.
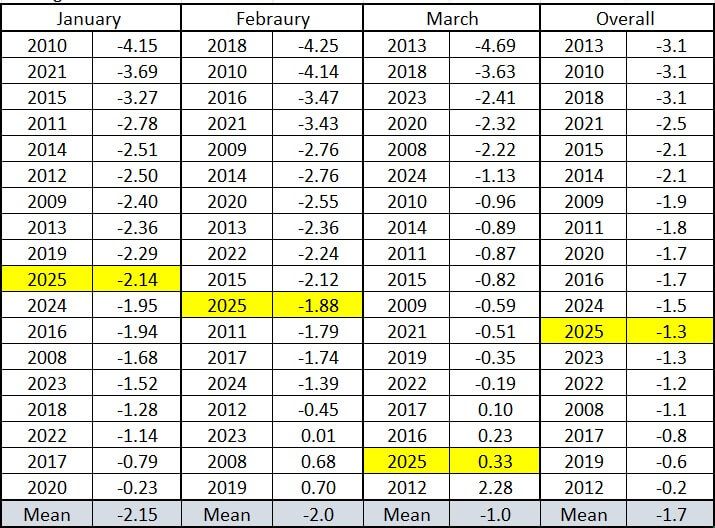
A table of the average January, February and March Aonach Mor summit midday temperature for each year going back to 2008. They are ranked from coldest to warmest. This year’s values are highlighted yellow. As can be seen both January and February were close to the mean, while this year March was the second mildest in the dataset. Combined these three months were slightly milder this year than the 2008 to 2025 average.

The January Aonach Mor summit midday temperature anomaly going back to 2008. All the years the anomaly is less than two degrees. There seems to be less variation in the January temperature than for February or March.
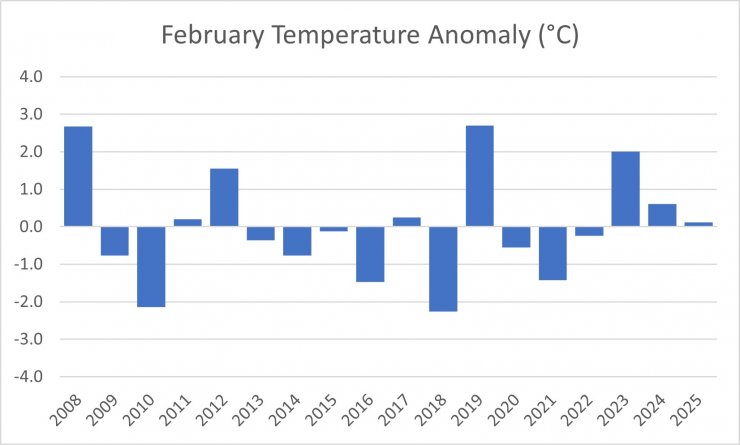
The same as above but for February. There is more variation in February than January with four or five years with an anomaly of greater than plus or minus two degrees.
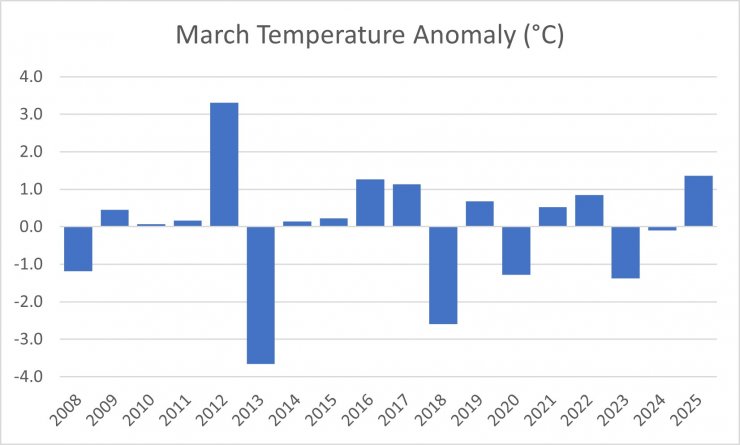
As above but for March. Large variations in temperature in March, particularly around the 2012/2013 period. This year March was just over a degree above the March average, similar to 2016 and 2017 which from memory were overall similar to this winter with long dry periods and not a great deal of snow.
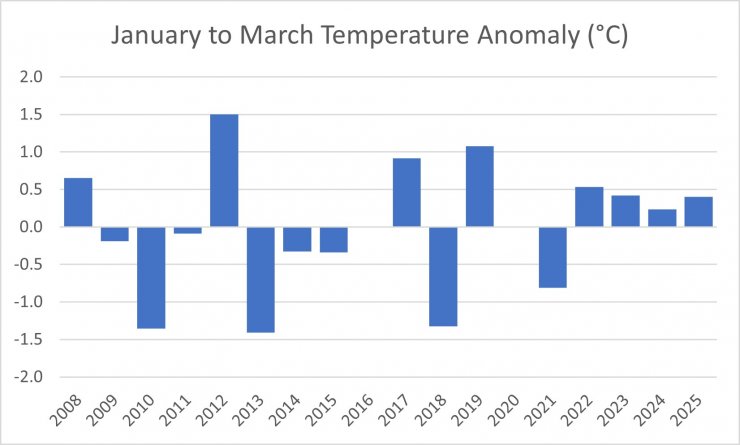
As above but for the the period of January, February and March inclusive. In both 2016 and 2020 the anomaly is so close to zero, that the bar associated with those years does not appear in the graph. The past 4 years have been the most consistent temperature wise with a small positive anomaly.

Snow fall amounts for the period January to March inclusive. The 24 hour snow fall amount is recorded on the snowpit data. It is done in a particular way for historical reasons and there are some weaknesses with this method. However, it is still useful to to compare roughly how much snow falls during one year as compared to another. The units of the left are non-dimensional, and they don’t really correspond to any physical measurement, and should be more viewed as a proxy for how much snow fell out the sky independent of whether it melted the next day or stuck around for a month. This figure shows the cumulative January to March snow fall. The snowy winter of 2014 stands out. This year January to March one of the least snowy beaten only by 2012. However, due to the timing of the snowfalls, and the thaws, this year there has ended up being less snow on the ground than even 2012 I would say.
Comments on this post
Got something to say? Leave a comment


Colin
31st March 2025 9:19 pm
Really interesting data. Thanks for posting.
Allan Crawford
31st March 2025 10:00 pm
Worst year I’ve seen for snow in the hills, though a couple of times we had some in the garden near Dornie, (not uncommon to not get any in the garden). When it rained it was too warm and though it had its moments it I don’t think it was a particularly wet winter, see what the MET people say tomorrow. When it was cold there was no rain and the mild spells were particularly mild but the last four winters have been poor.
Thanks for the data !
lochaberadmin
1st April 2025 2:12 pm
Thanks for your comments, and glad peopled enjoyed the analysis. In summary not a great winter, lets hope for a good one next year.
David Myatt
1st April 2025 7:58 am
Many thanks for this and your earlier analyses.
Matthew Baker
1st April 2025 4:35 pm
Interesting data, thanks, is there any Jan to March average temperature data available from say 1980 onwards to put the recent seasons into a wider context?
lochaberadmin
1st April 2025 5:14 pm
Hi Matt, glad you like it. Unfortunately the data set that I have been using only goes back to the winter of 2007/08. I am not sure how long for example the weather station on the summit of Cairngorm has been operating, and whether it would be possible to access that data. Something to look into at some point.