Days Below Freezing.
30th March 2025
It was a cloudy start, but cleared up though the day. The summit temperature were just below freezing overnight rising to just above during the afternoon. A few photos from today at the start of this post followed by some data from the past few months, and how it compares to other years.

Icy rime of a pole at 1200 metres. I wrote in a previous blog post about how at temperatures around or just below freezing rime tens to be very icy. Today was a good example of that, the temperature has been hovering around or just below freezing the previous 24 hours and it had been cloudy on the summits This has resulted in a icy rime on the left side of the pole, with the rest of the poles encased in a clear layer of water ice.

The top of Easy Gully. Visibility was not as good as I had hoped, but it was certainly a lot better than the past couple of days.

Looking along the top of the crags to the South of Easy Gully during a bright spell. I thought I was in for some pleasant sunshine, but it didn’t quite happen (until after I got done when it did clear up properly). All the snow in the foreground is fresh snow from the past couple of days. However, it is not that deep.

The top of Right Twin are. A few sections of cornice exist, but these are not very extensive or large.

The view down into Coire an Lochan. The cloud didn’t quite clear when I was up there, but it was clear enough to see how little snow there is in the Coire.
Given it is almost the end of March, I did some analysis on weather data from the past three months The reason I chose this period is that (with the exception of 2020 when covid hit) we have weather and snowpit data for all of January, February and March each year going back to 2008. This makes the data easy to compare, and is not affect by, for example, the different dates in December that we start forecasting each year. Today I have focussed on the number of days below freezing, and the the number of days rain is recorded. Tomorrow I will try and do something on summit temperature.

Firstly starting with January. Above shows the number of days each January over the past 18 years that the Aonach Mor midday temperature has been above freezing. This year, with 5 days above freezing, was slightly lower than average of 7 days.

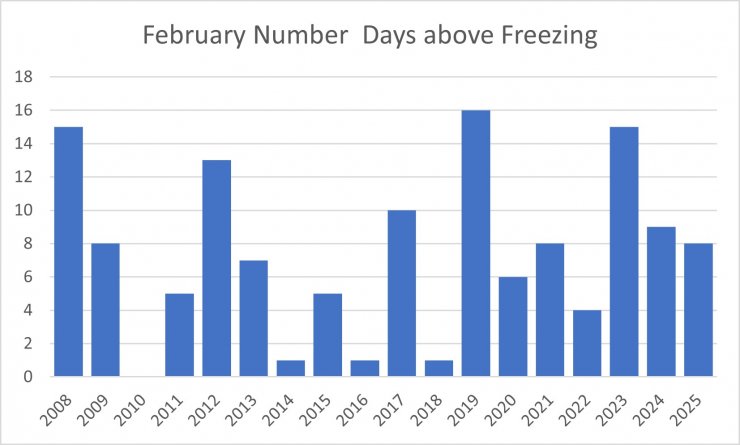
The number of days each February over the past 18 years that the Aonach Mor midday temperature has been above freezing. February shows much more variation than January or March with the likes of 2010 when no days were above freezing to 2019 then 19 days (57% of the total) where above freezing. This year with 8 days above freezing is slightly above the average value of 7 days.

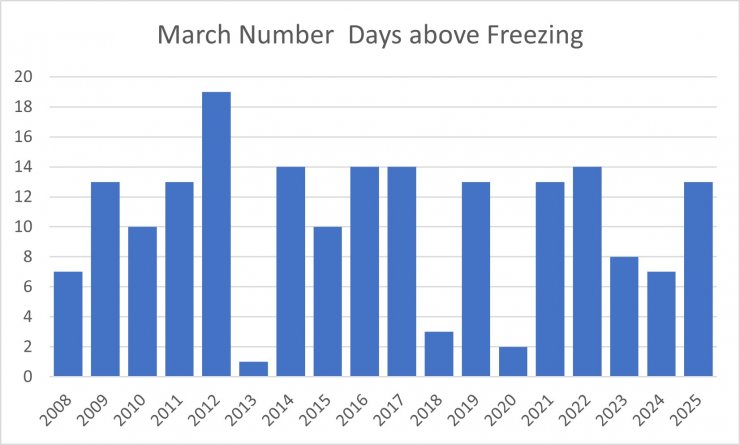
The same for March. Many March’s have see between 10 and 14 days above freezing with a few colder months such as 2013 and 2018. 2020 as well, but the data for this month only runs to about the 23rd of the month when we stopped forecasting due to covid. For this March the data I analysed only runs to the 29th, and given today and tomorrow are likely to be mild for this year the total is more likely to end up being 15 than 13 days. The average is 10 days.

Combining the data from the above graphs gives the total number of days the Aonach Mor summit temperature was above freezing during January, February and March each year since 2008. This year there 26 such days (up the 29th of March, probably 28 days by the end of the month). This is not that far from average for the dataset of 25 days, and far less than the likes of 2012, 2017 and 2019 with over 35 days. By this metric this year the weather during this period was nothing unusual. However, if you look at the amount of snow on Aonach Mor, it has been unusually (exceptionally?) little snow. Is the lack of snow this year due lack of snowfall rather than warm temperatures, I would say that is a major part of it.

The number of days that rain was recorded at 900 metres in Lochaber during January, February and March. This year was one of the least rainy years. The two other years when not much rain was recorded (2013 and 2018) were also years when there were relatively few days above freezing on the tops. I am not sure if there was not much rain recorded those winter because there was little precipitation, or because that precipitation fell mostly as snow. It was probably a combination of the two factors. However, this year January to March there have been fewer days when it has rained on the hill. It certainly agrees with my feeling that I have worn my waterproof less than normal this winter (which is pleasant).

SEPA data for monthly rainfall in Glen Nevis. Although March is not over yet, there very little rainfall forecast in the next few days. During January there was about 90mm or rain, about a third of the typical January value. February was dry but closer to average with just over 200mm. March has seen about 110mm, just over half of the typical rainfall. In fact in the previous year only April, August and December have been above average in terms of rainfall.
Comments on this post
Got something to say? Leave a comment


Mark Figiel
30th March 2025 8:39 pm
Fantastic statistically information on the last 3 months. Very much like we we discussed earlier. The weather patterns in terms of direction of weather fronts coming in are very different than the norm I would say. Wind direction seems more from North to South east than North west to South west.
lochaberadmin
31st March 2025 6:58 am
Yeah, I would agree. We have seen little polar maritime or returning polar maritime air this winter, and those seem to the air masses that give us the snow.
Greg Macmillan
1st April 2025 7:30 am
Thanks for your insight. I love reading these blog posts!
Ian Matheson
1st April 2025 9:14 pm
Myself, friend and his dog did Aonach Mor and Beag on Sunday and were in the clag for most of the day, so it’s great to see these photos and I do love a good data set!
Did we speak to you briefly on the way up? Don’t suppose you got any photos of us as we rounded the top of the crags?
lochaberadmin
2nd April 2025 8:01 pm
Hi Ian, glad you enjoyed the post. Glad you made it to Aonach Beag. I am afraid I didn’t get any photos of you that day.