A Good Graph 2
3rd April 2022
I managed to get up and get a brief view this morning before the cloud and light snow arrived during the afternoon. Looking like the weather will become a bit more unsettled tomorrow. I also created a few more charts to compare this season to previous seasons. There are lots of ways the data could be displayed. However, different ways do seem to do seem to show the winter being; pretty average in terms of wind, milder than average and not as much snow as usual. This would generally agree with my on the ground observation.
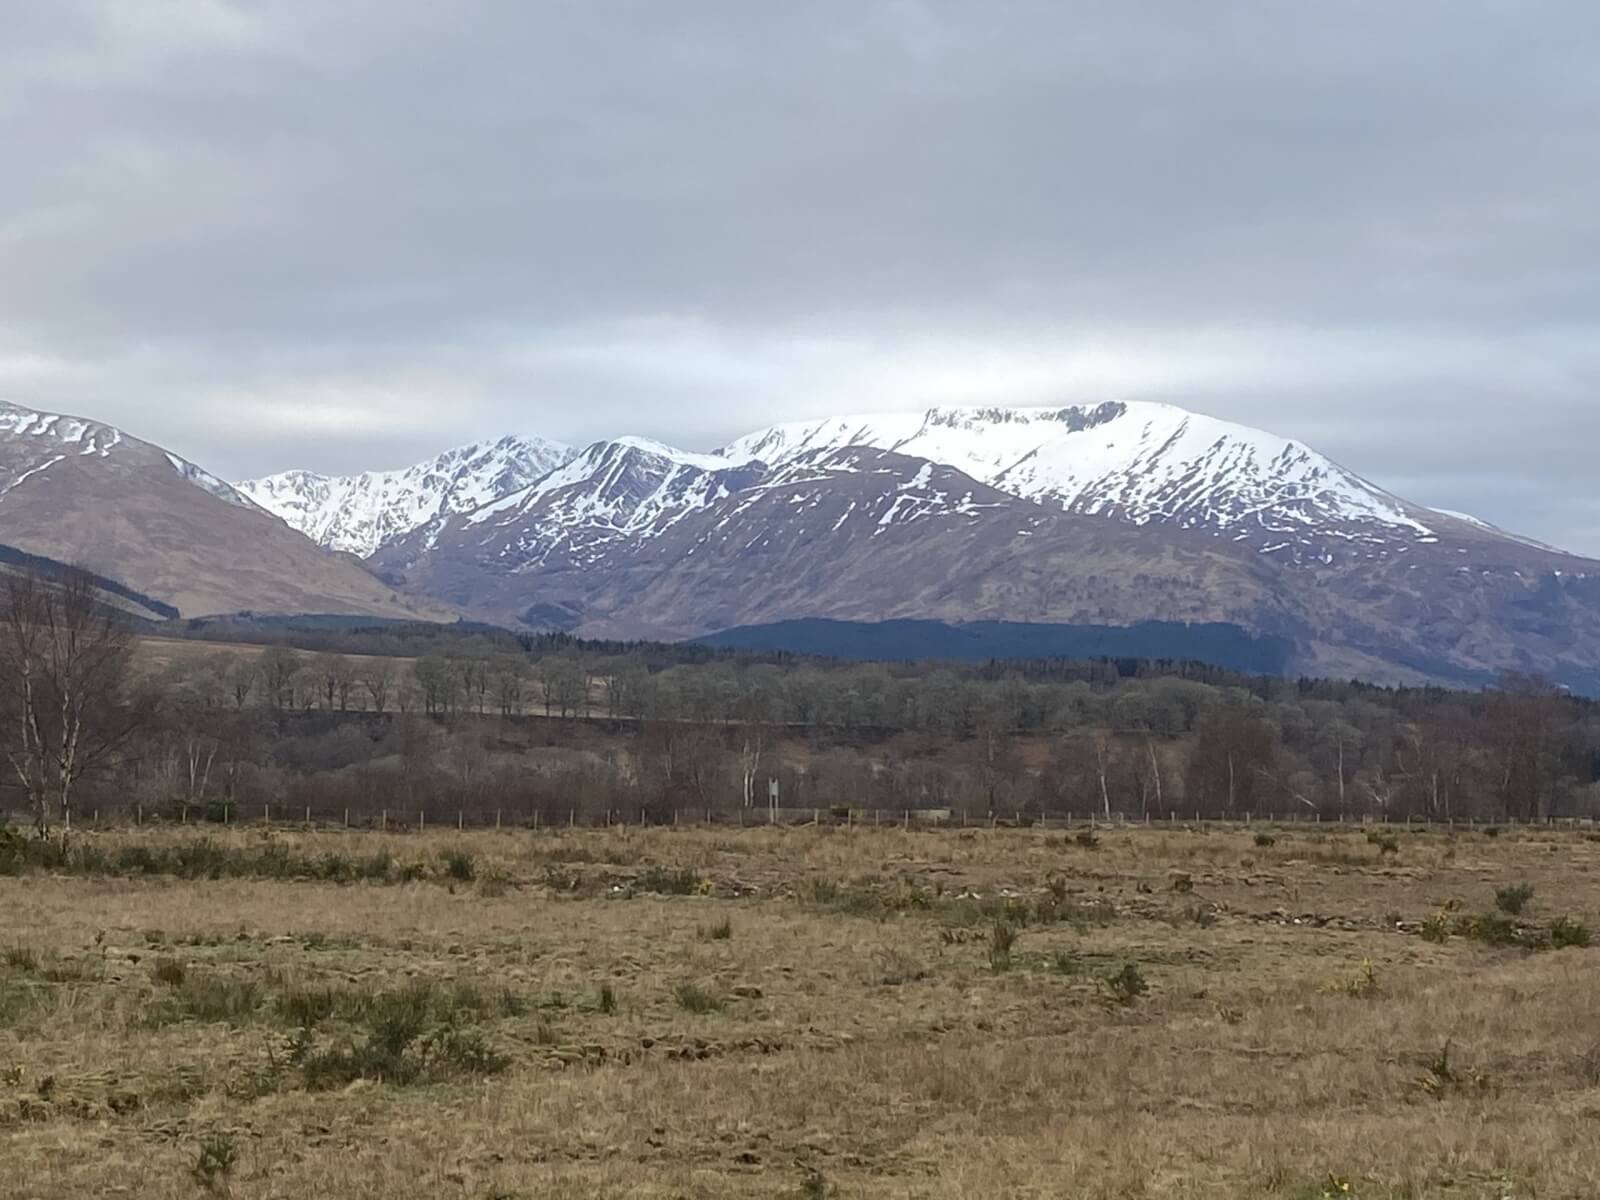
The East Face of Aonach Mor from Roybridge this morning.

Trying to clear! The view down to Stob a Cul Choire. There is quite a difference in the amount of snow on the north (left) side of the ridge compared to the steeper South (right) side of the ridge.Â
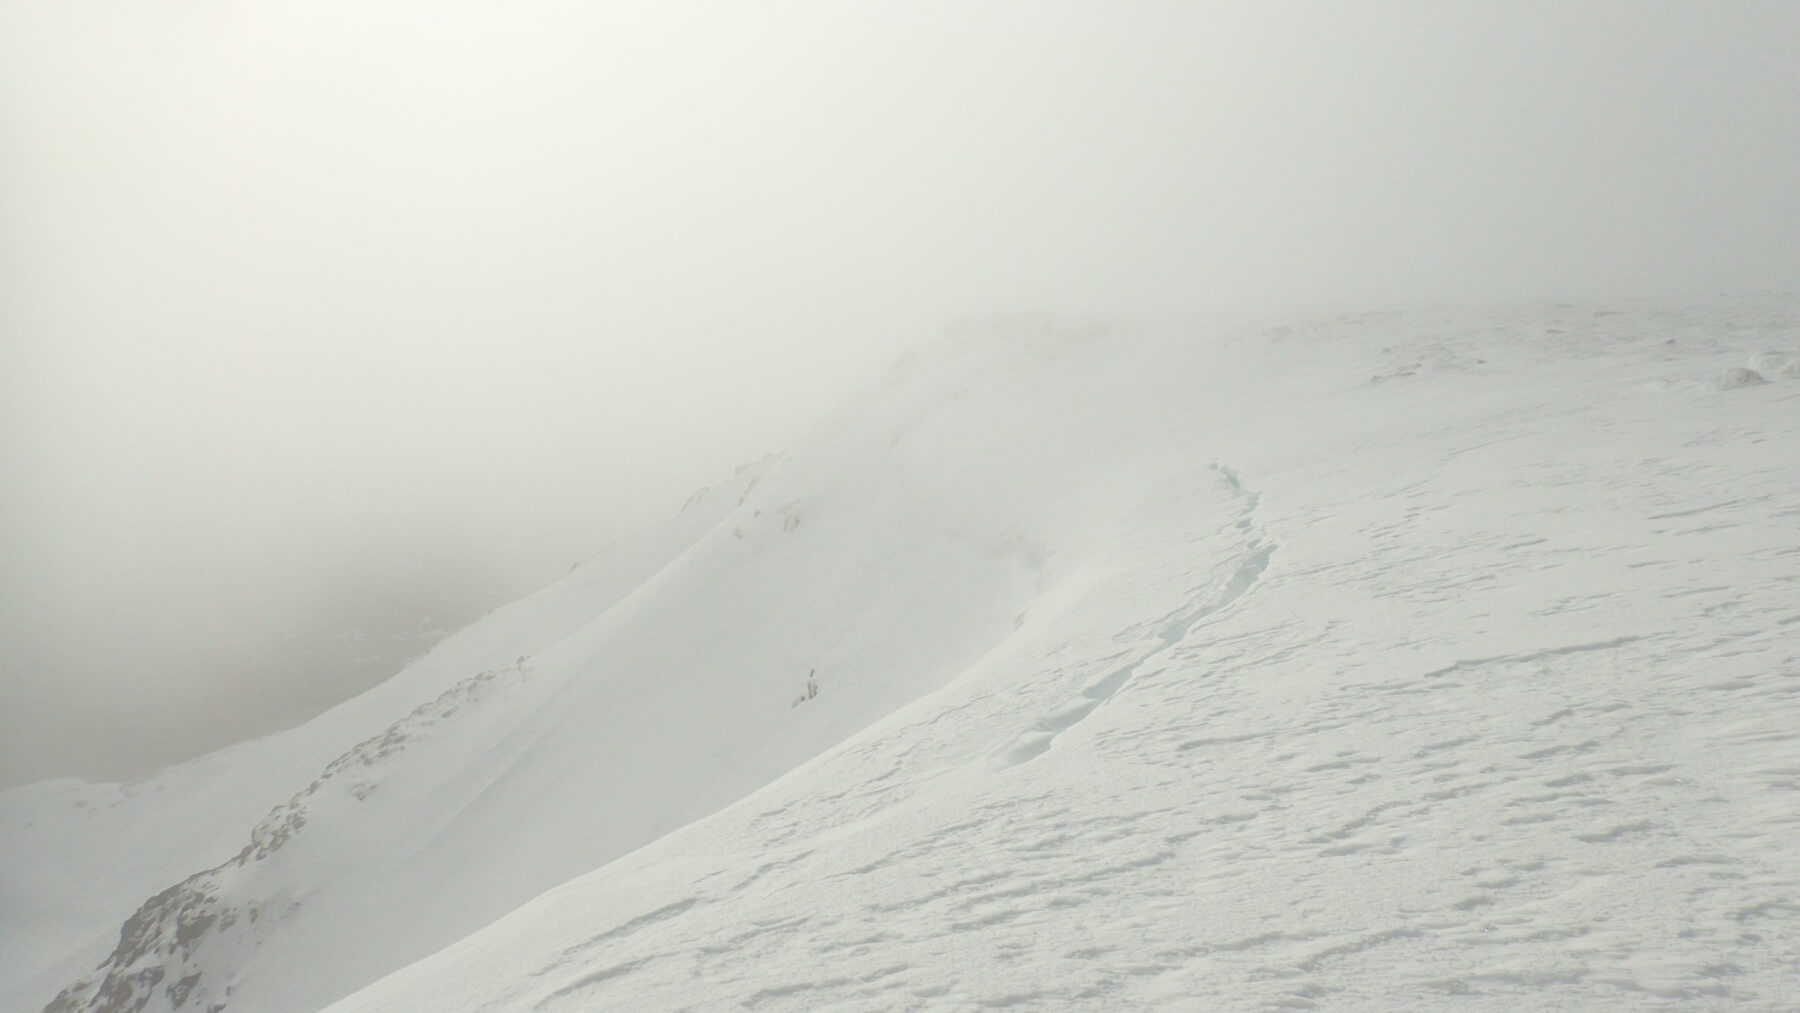
Glide cracks in the snowpack.Â

On the way down the hill it cleared up briefly before the afternoons cloud and snow arrived. As can be seen the foreground there are some unstable section of cornice remain. These tend to be pretty stable in the current cold conditions. However, they will become more prone to collapse in the milder conditions tomorrow.Â
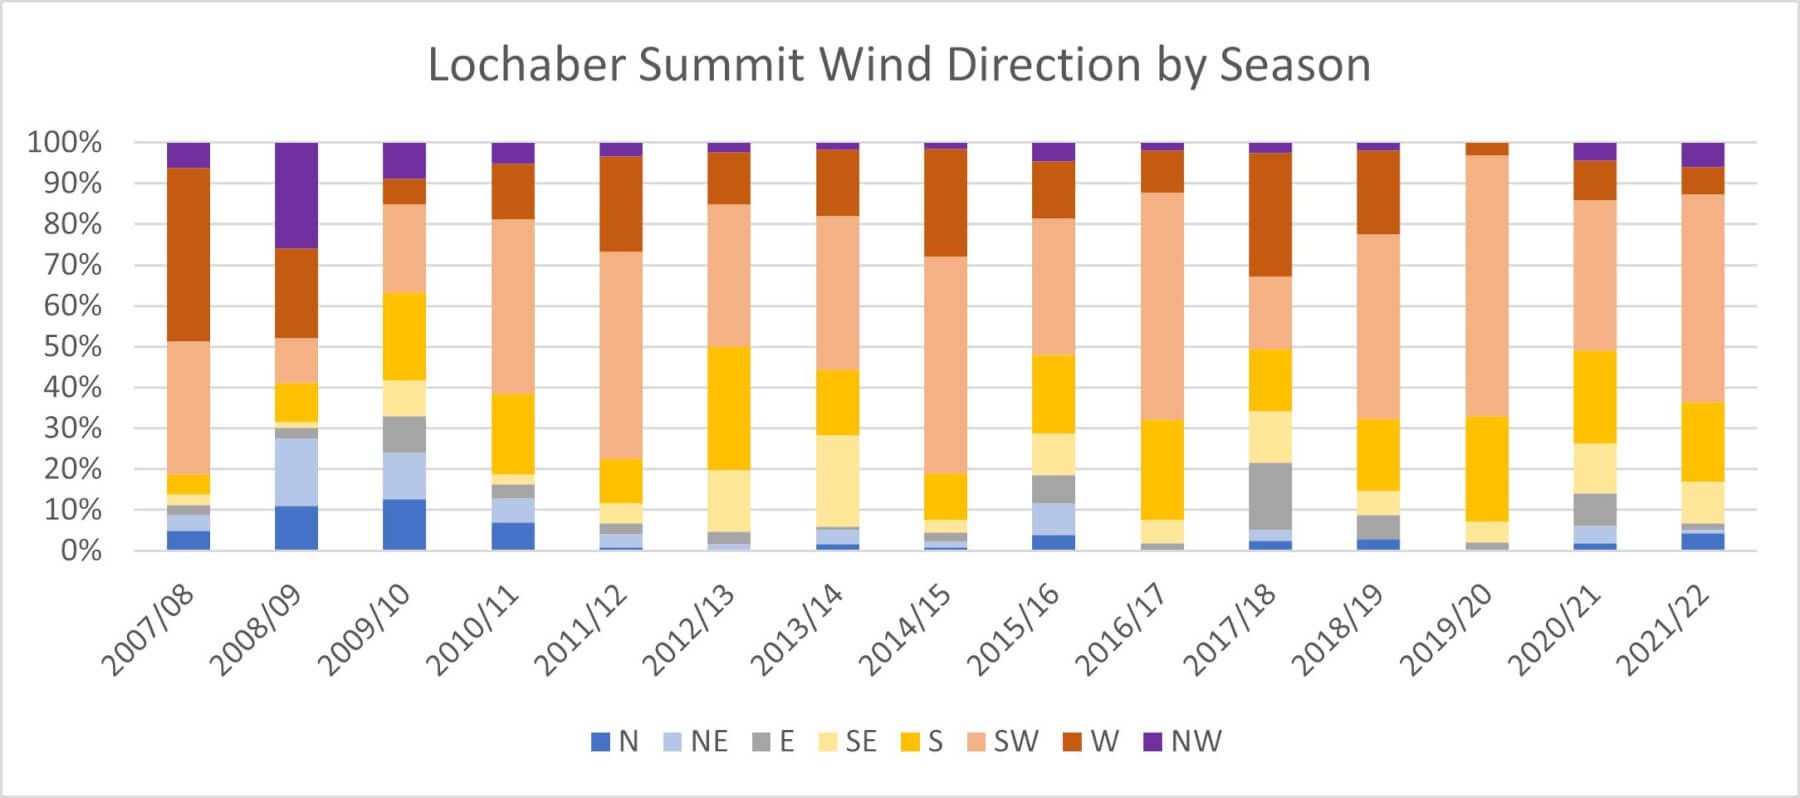
A chart of the percentage of time the summits wind has been from different directions over the past 15 seasons from SAIS snow pit weather data. This season the winds has been from the South-West 51% of the time. This is the same as 2011/12, and less than 2014/15, 2016/17 and 2019/20. During the latter the wind was from the SW 64% of the days.Â
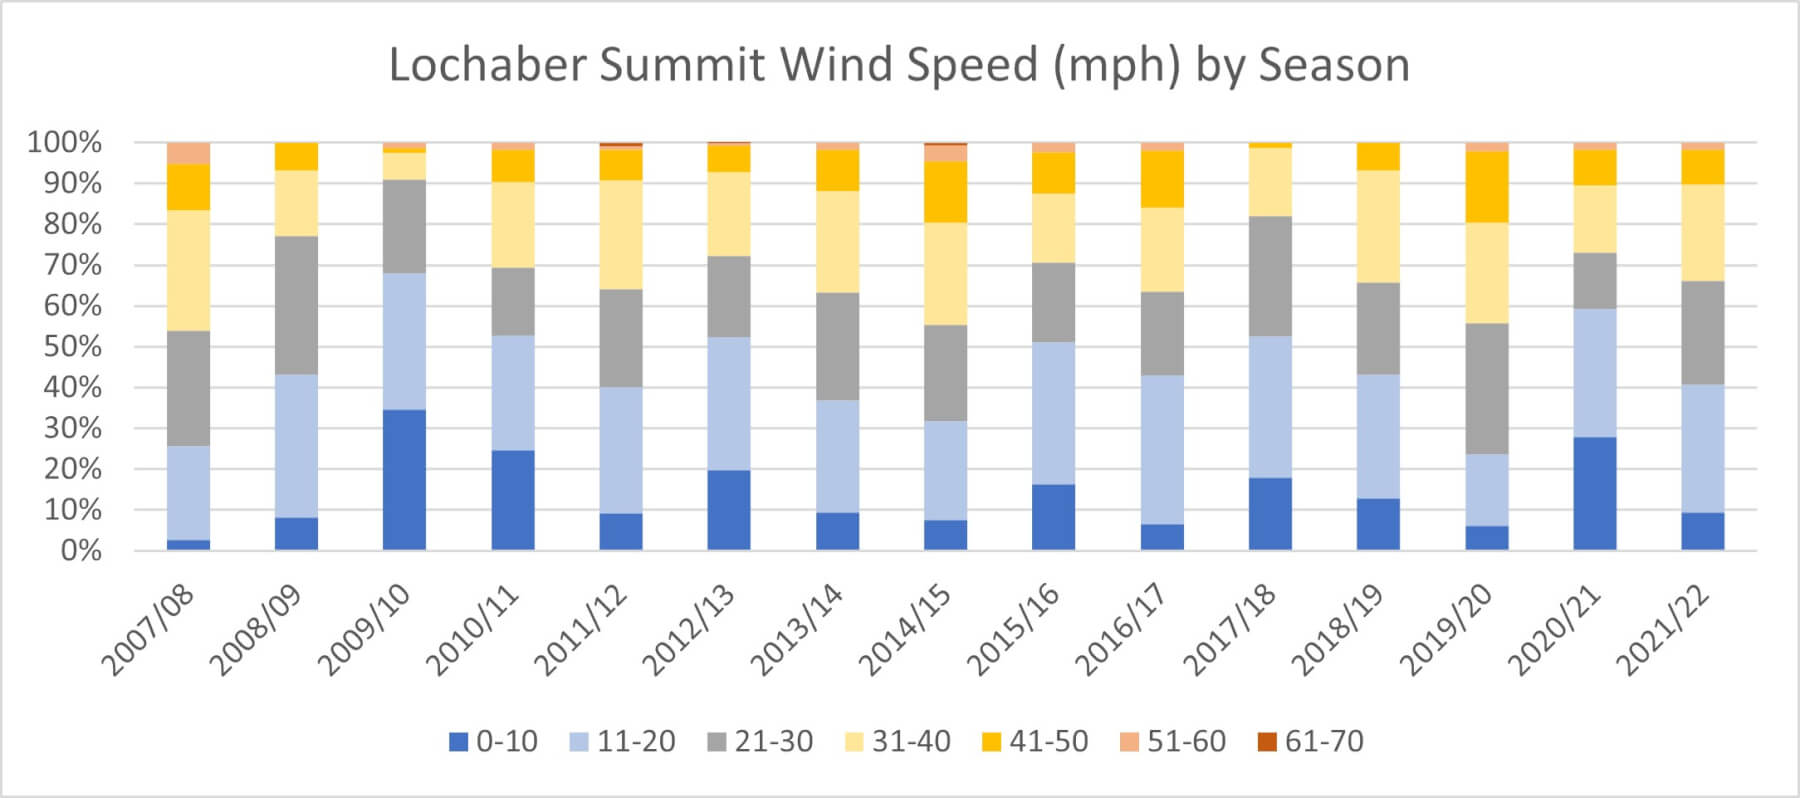
A chart of the percentage of days the 24 hour Aonach Mor wind speed has been in various strength bands over the past 15 seasons from SAIS snow pit weather data. The daily average wind was less than 30mph on 66% percent of days (very slightly less than the average which is 68%). The calmest season was 2009/10 when it was less than 30mph 91% of the time. The windest winter (by this measure) was 2007/08 when the winds was less than 30mph just 54% of the time.Â
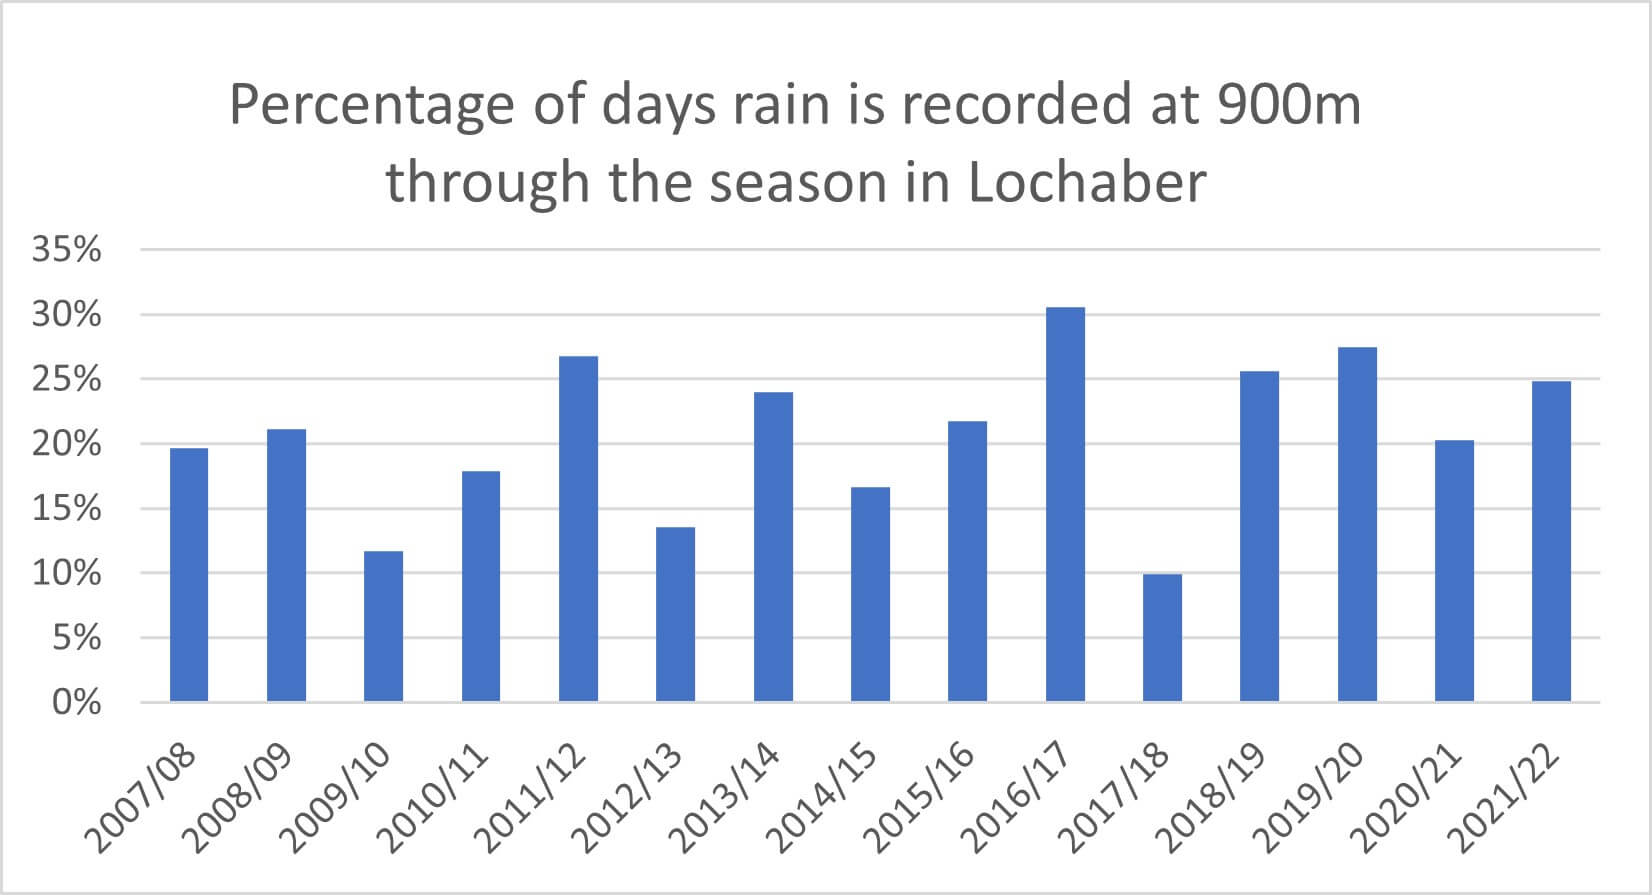
Percentage of days when rain was recorded at 900m in Lochaber. This season (up to the end of March) it was 25% of days, more than the average of 21%, but not as testing for the waterproofs as 2016/17 when it was 31% of days.Â
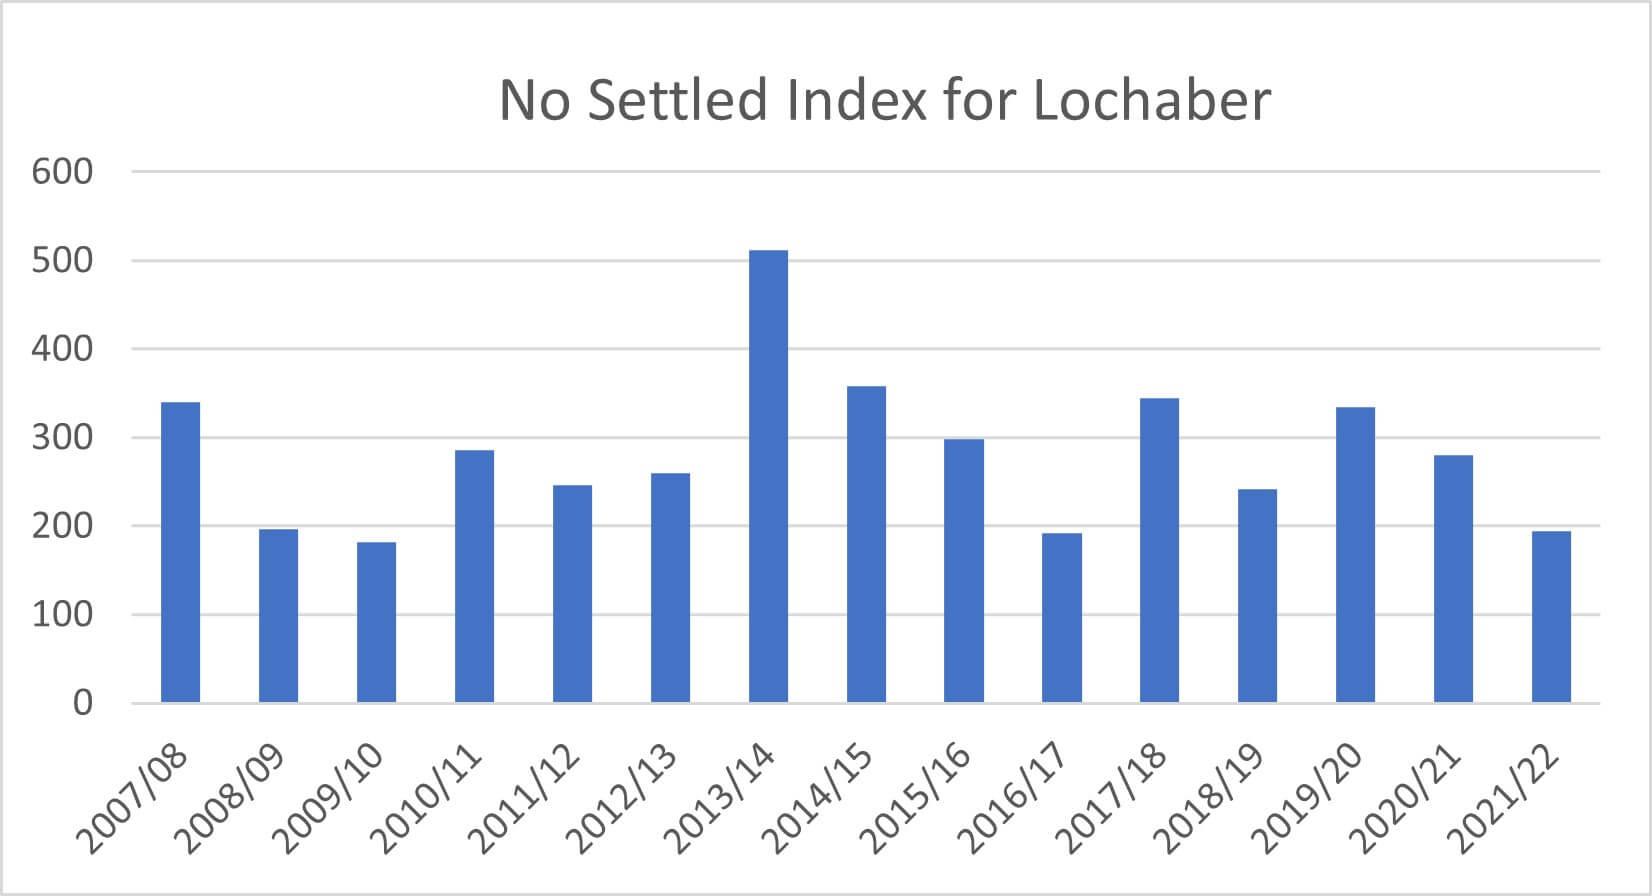
The no settled index. This is a rough measure of how much snow has fallen during the season. Admittedly the season is not over yet, but on the other hand the season did start a bit earlier this year. The values in themselves probably don’t mean much (they don’t correspond to cm’s or anything like that), but are probably a reasonable way to compare different seasons. Although not the least snowy, this season is definitely below average.Â
Comments on this post
Got something to say? Leave a comment