A Good Temperature Graph
31st March 2022
It was another cold but generally dry day in Lochaber today. The snowpack is frozen hard, and is quite icy. Temperature is such an important part of snow conditions and avalanche forecasting. Today for example, the overhead conditions to similar to those at the weekend, but due to the lower temperatures the snowpack is very different (generally soft at the weekend, like concrete today). Given that tomorrow we will be into April, I thought it would be interesting to do some graphs of summit temperature for the core months of this SAIS season (ie January, February and March) compare with those of previous seasons. Who doesn’t enjoy a good temperature graph! However, before you scroll down for the results have a ponder, how cold would you say this season has been compared to previous seasons; warmer, about average or, colder. Which month has been coldest both in absolute terms and relative to average (I will give you a clue, it same month in both cases).

Ben Nevis and Carn Mor Dearg this morning.Â
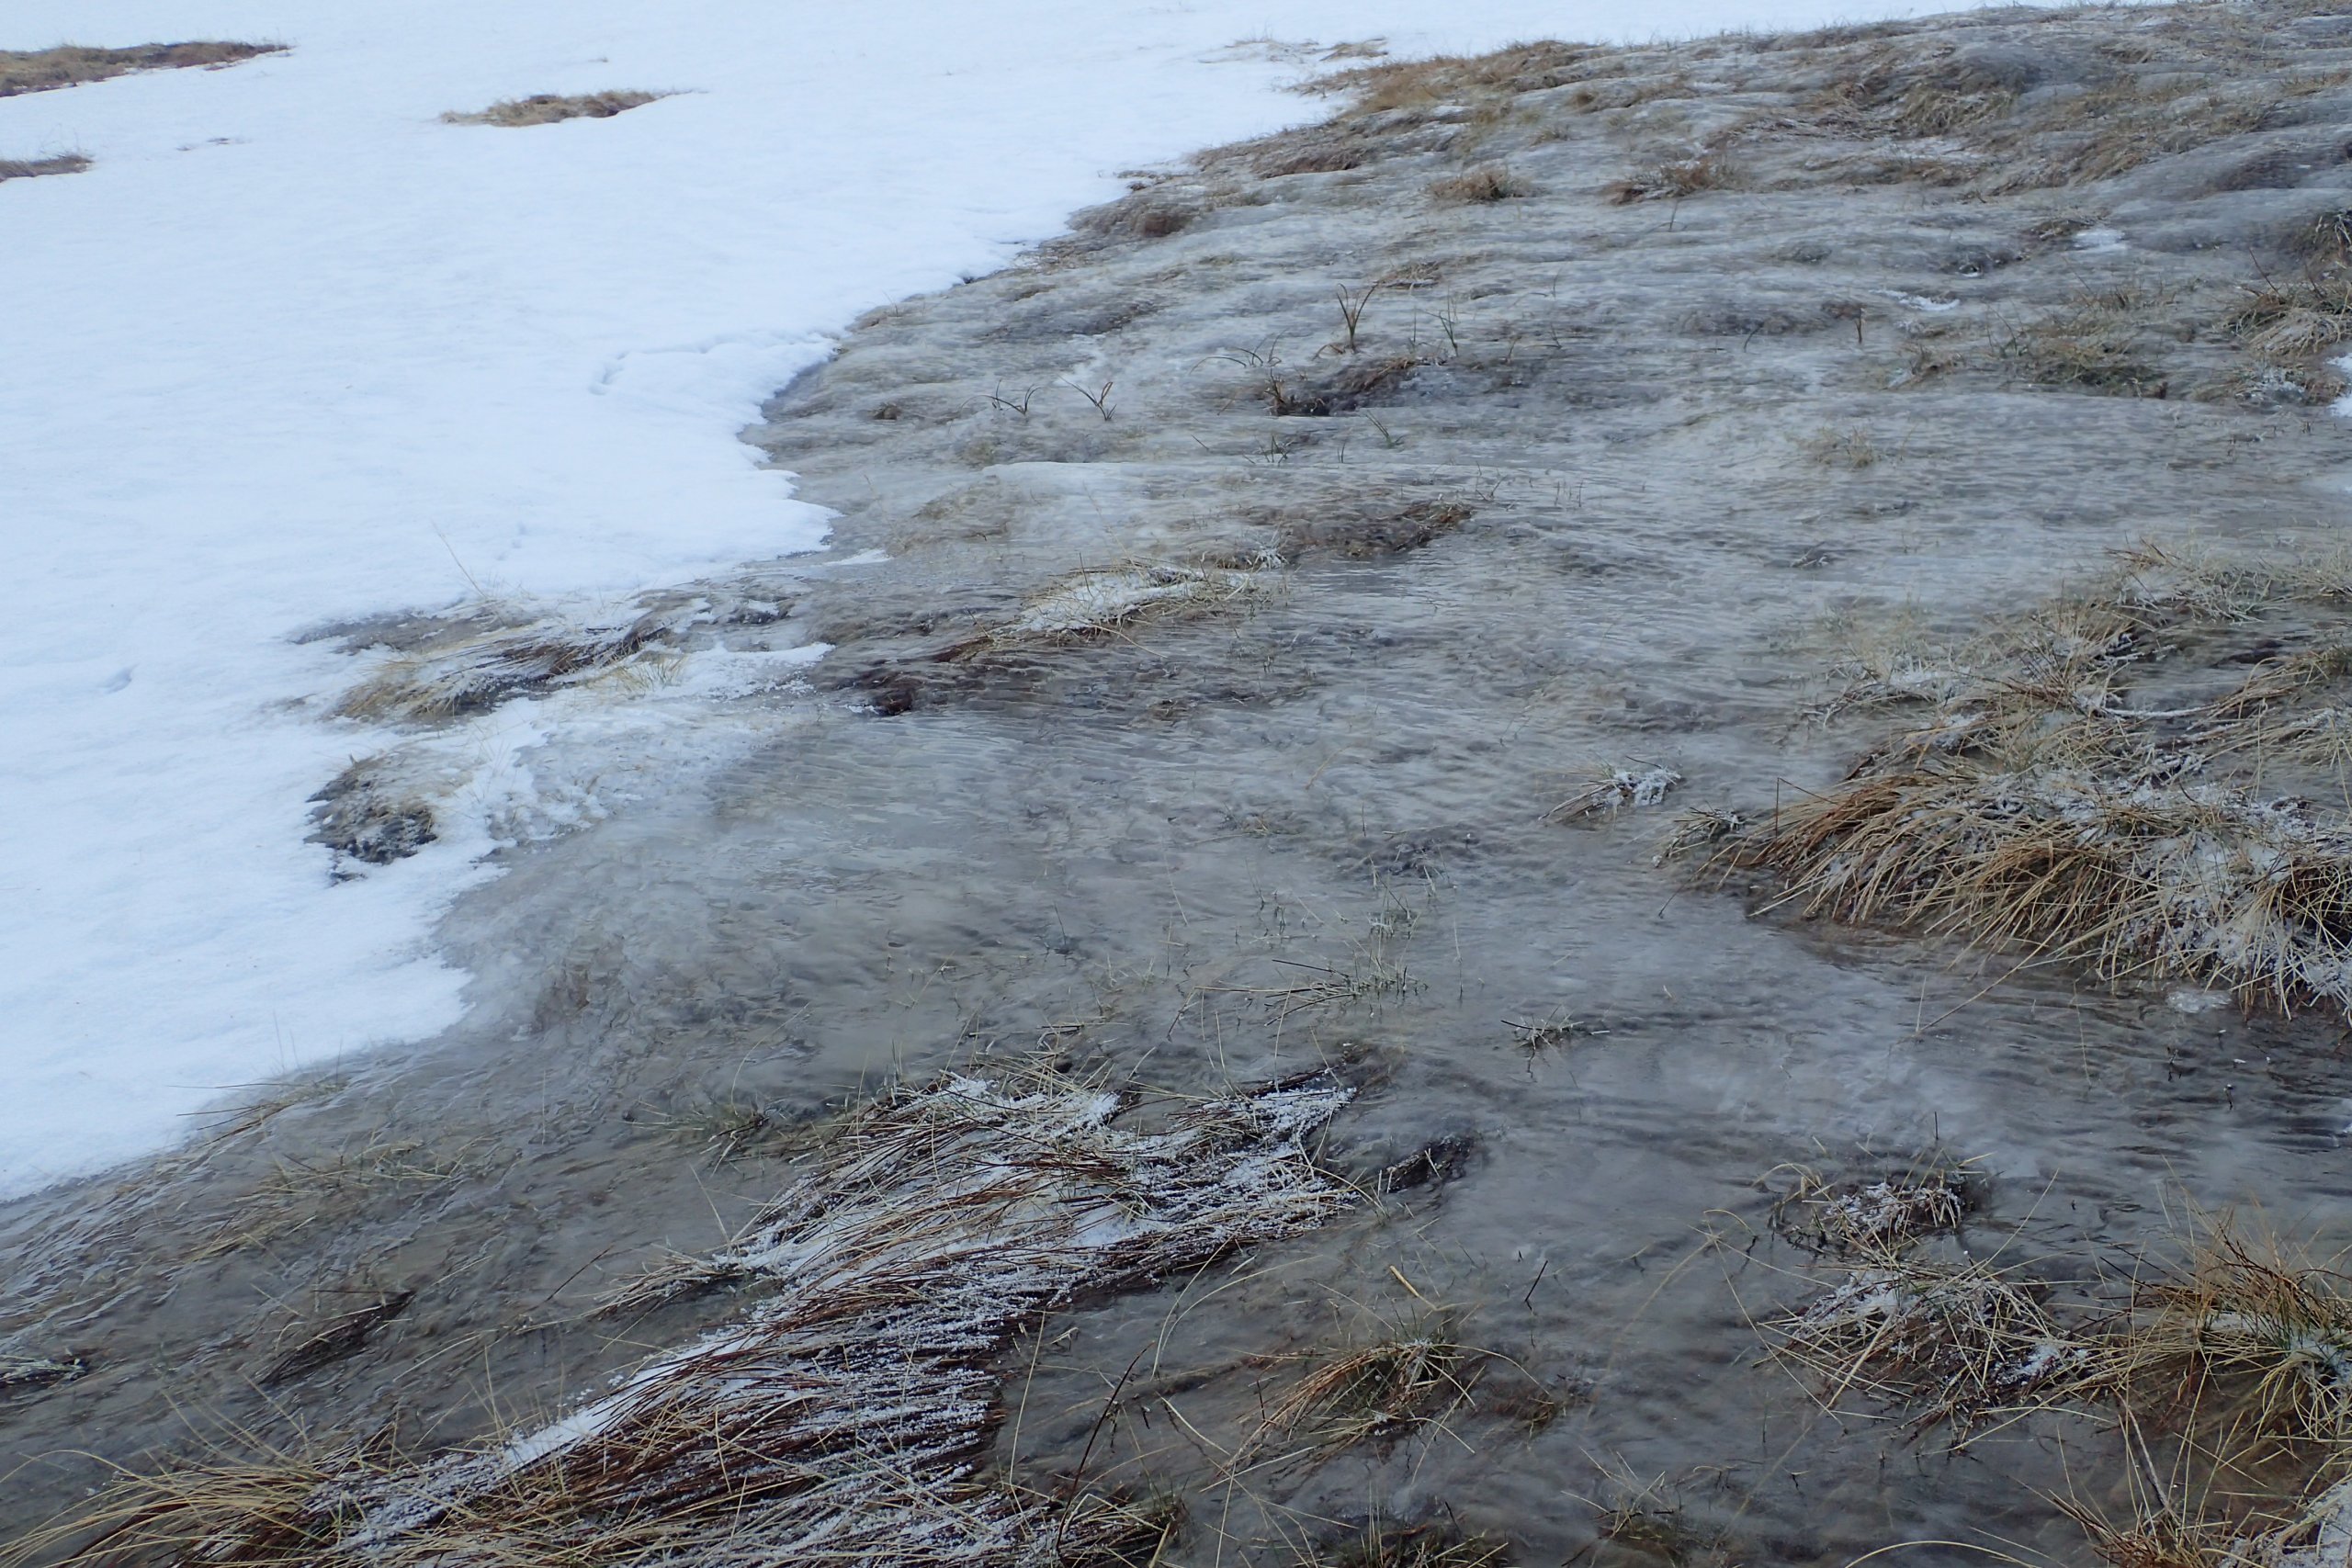
Ice forming on hillsides in the cold conditions. The snowpack did not feel much softer!

It was a bit cloudy on top. However, it was enough to see that some cornices survived the mild conditions.Â
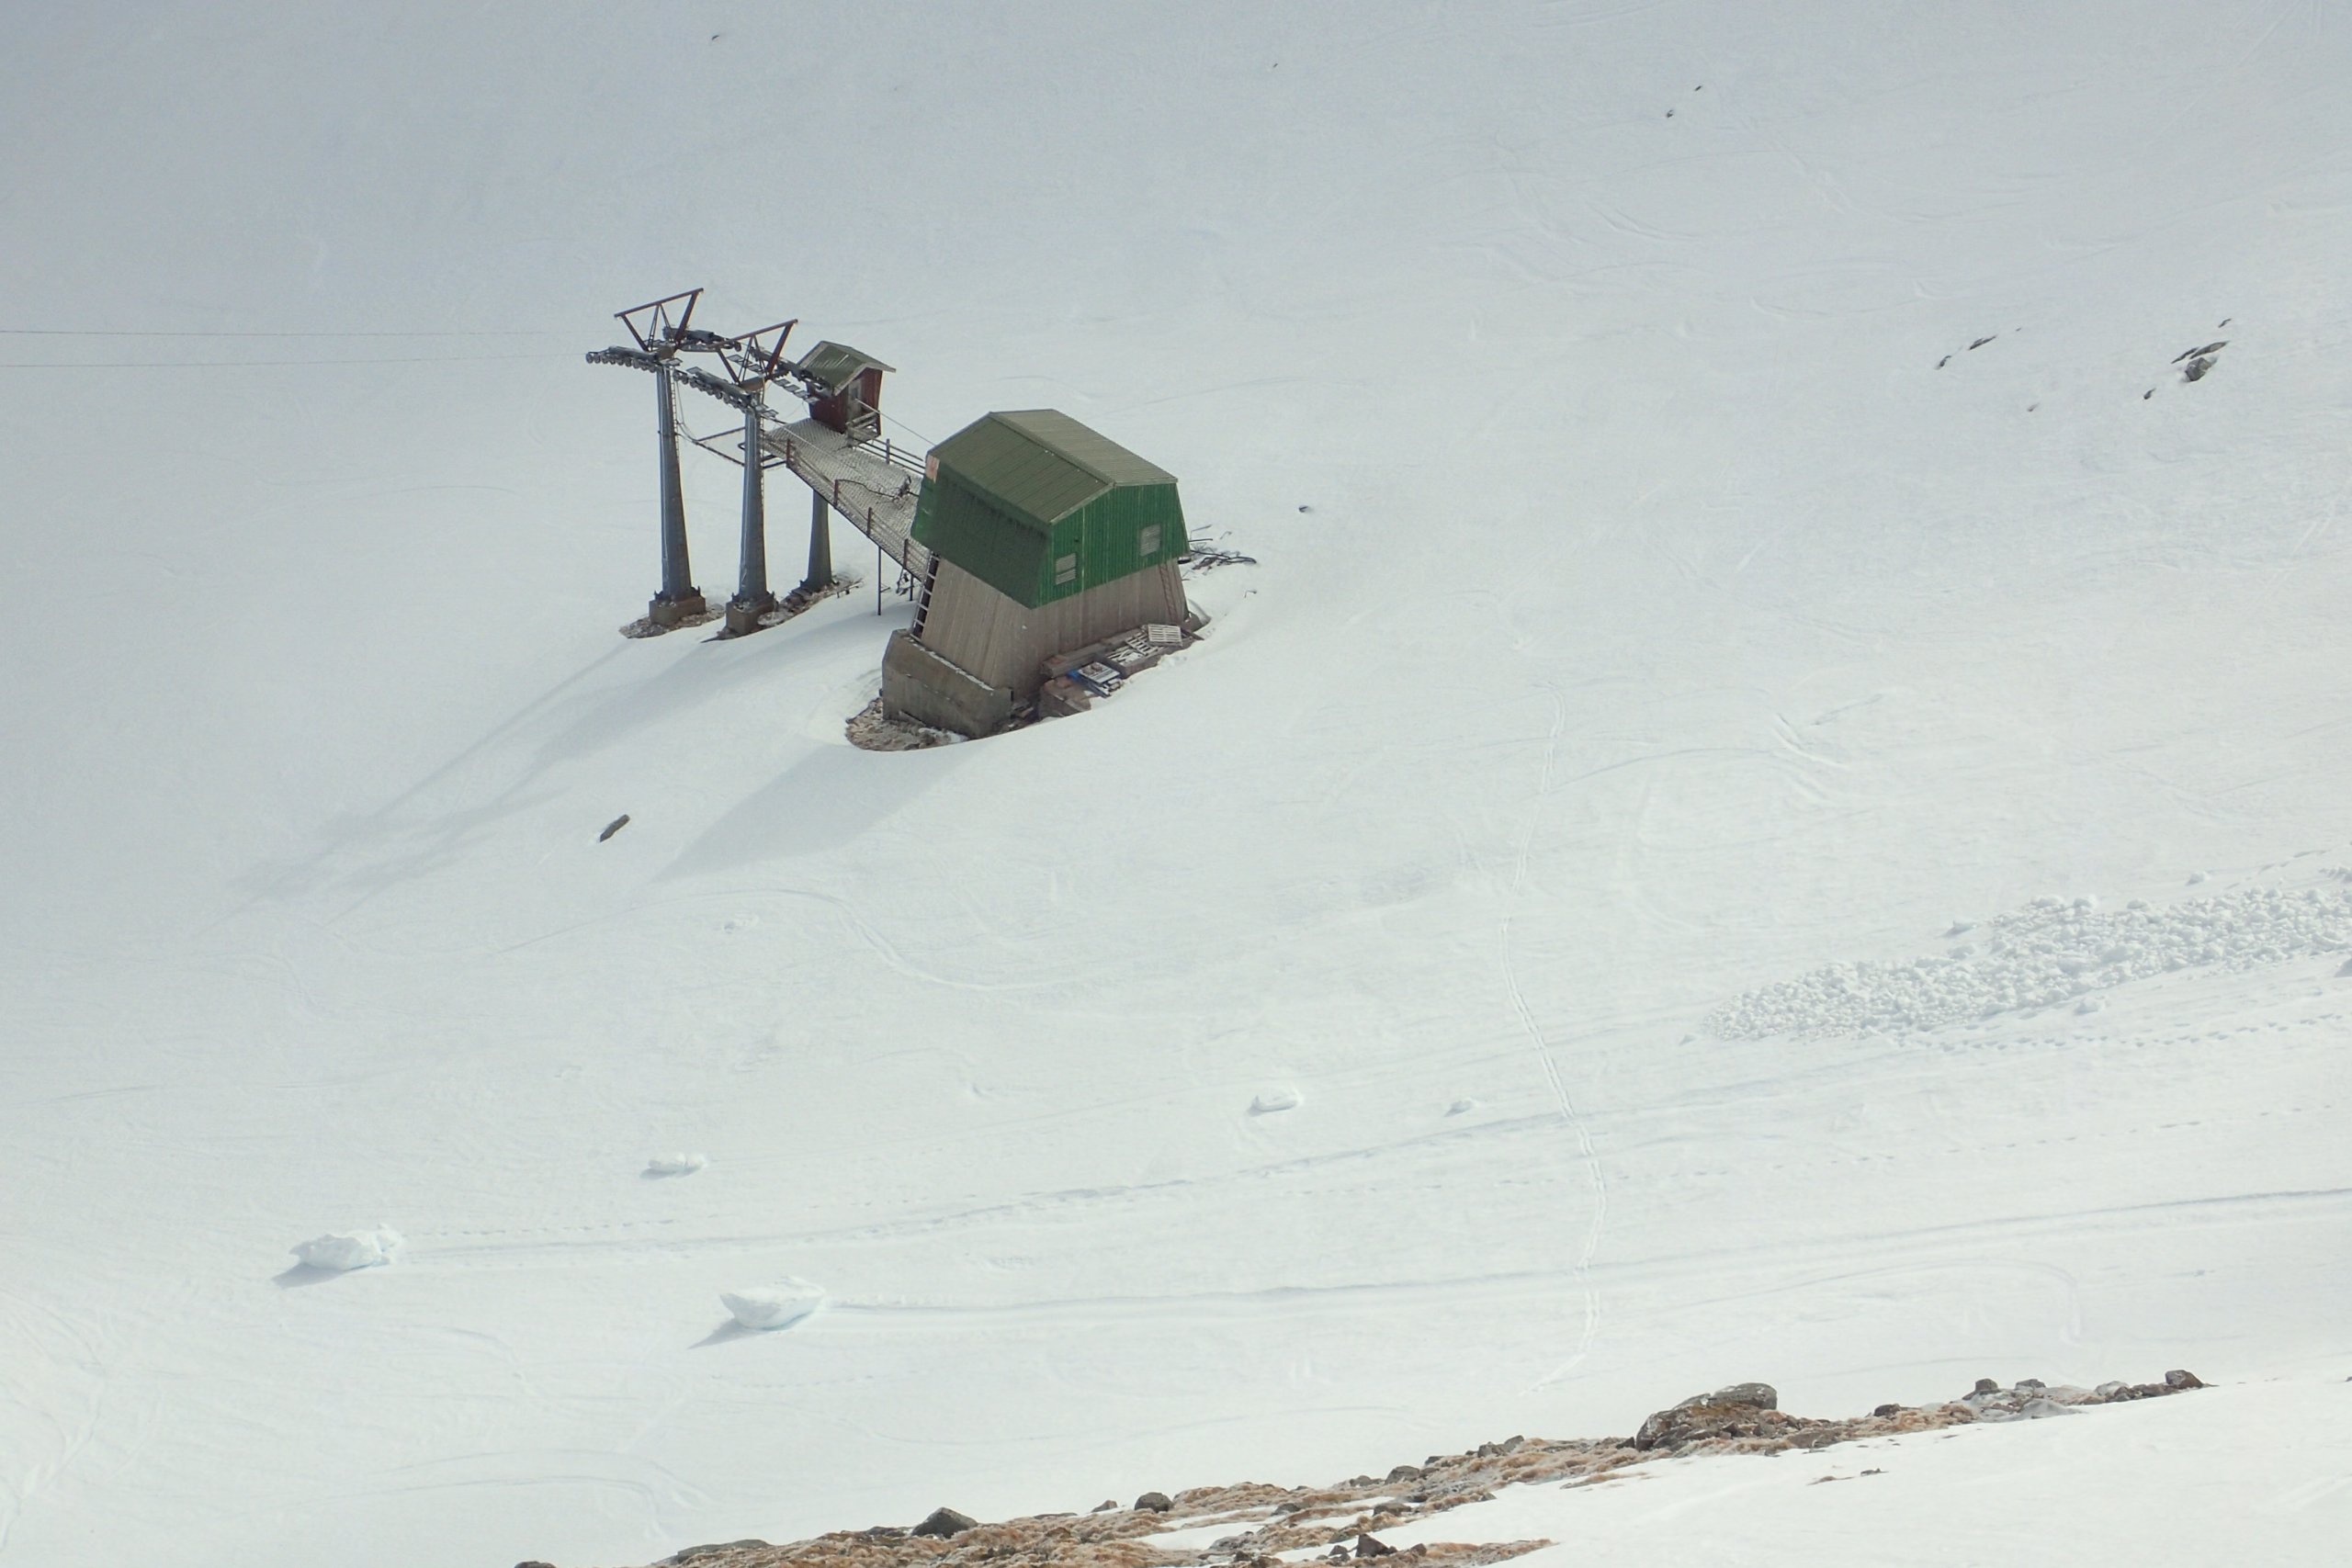
Some significant chunks of cornice did fall off when it was mild, and slid down to almost level with the top of the braveheart chair.Â
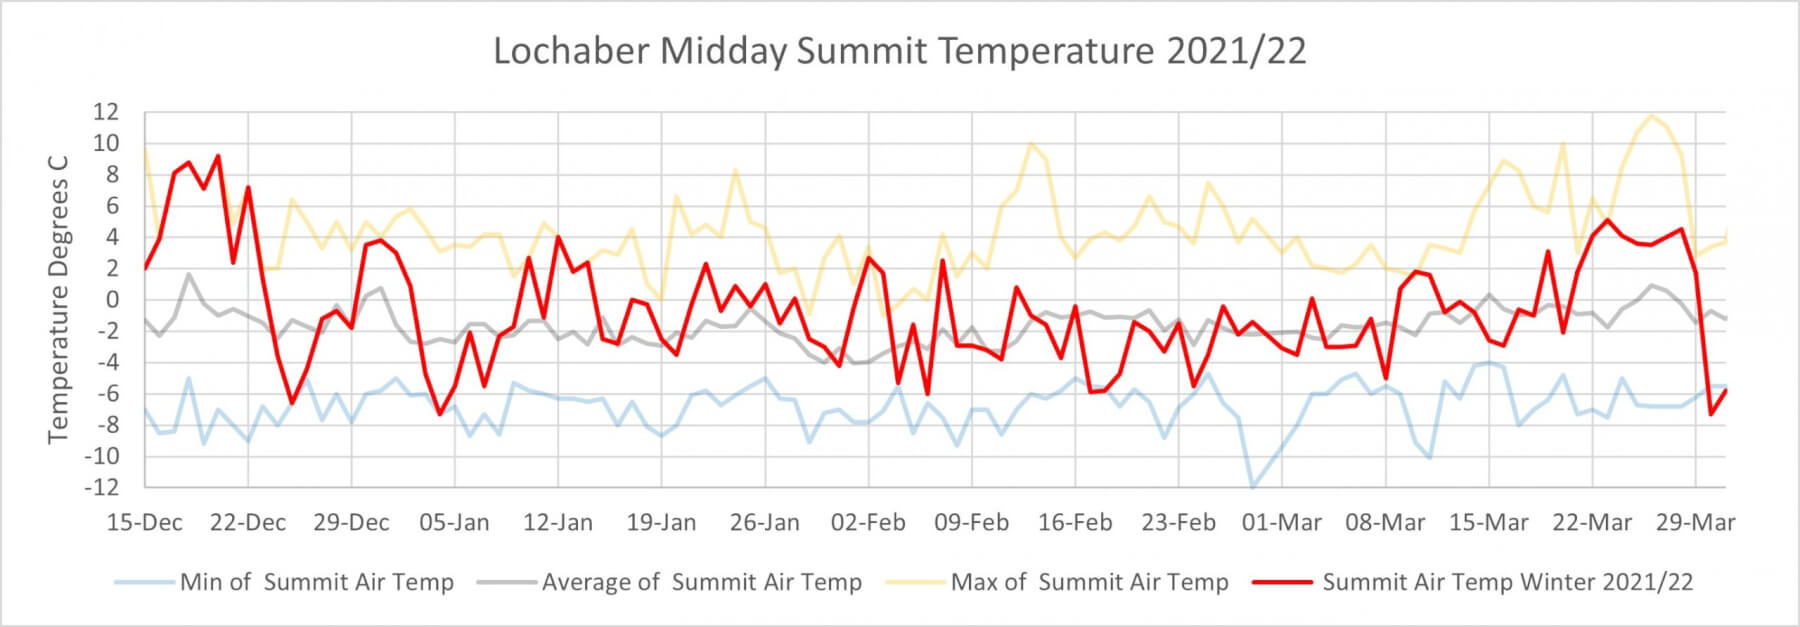
A graph of the this years Aonach Mor midday summit air temperaturee as compared to the maximum, average and minimum values from the previous 15 seasons.Â
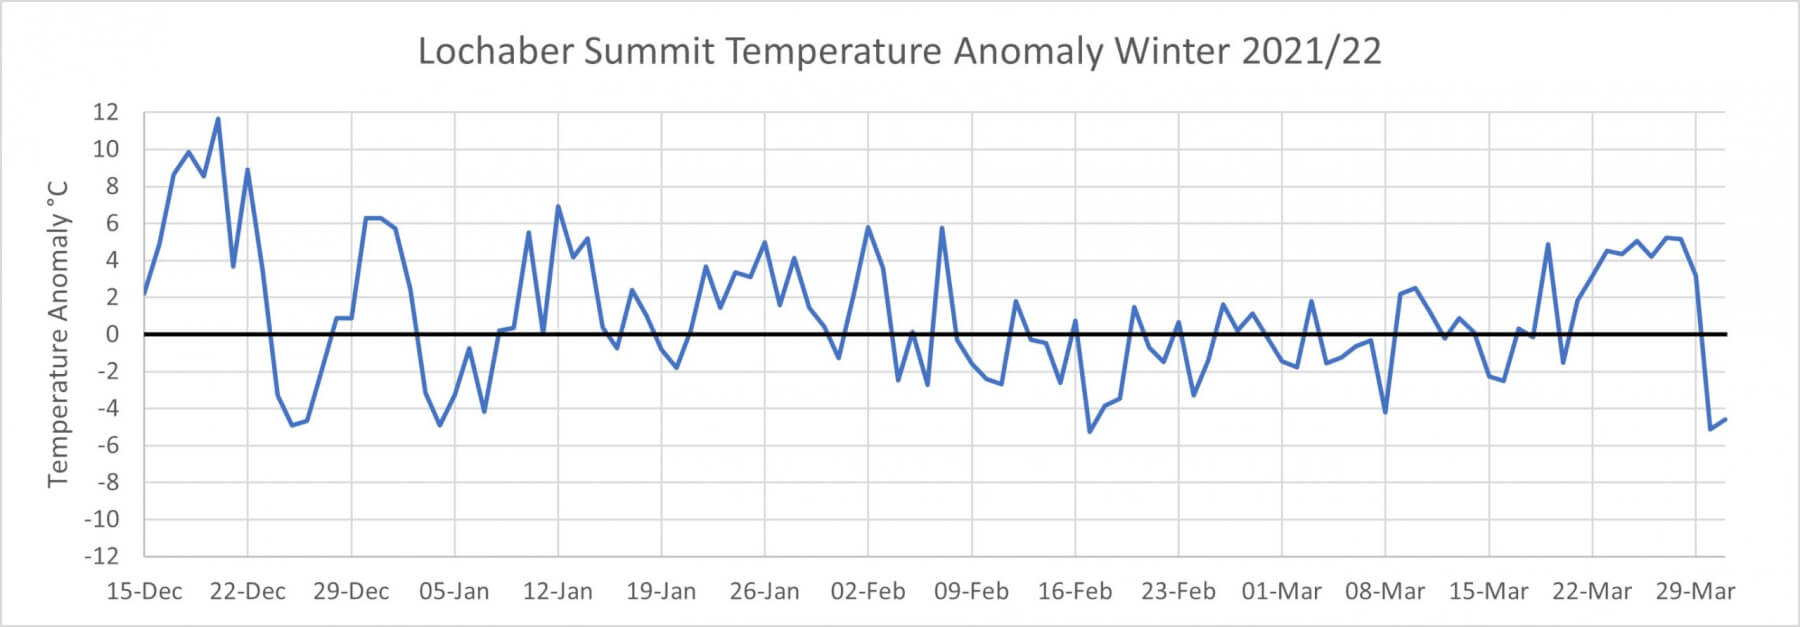
A graph of this years temperature Aonach Mor temperature anomaly. As can be seen other than a couple of brief periods it was milder than average for most of December and January. February looks to be slightly colder than average as was the first half of March, before a mild end to the month.Â
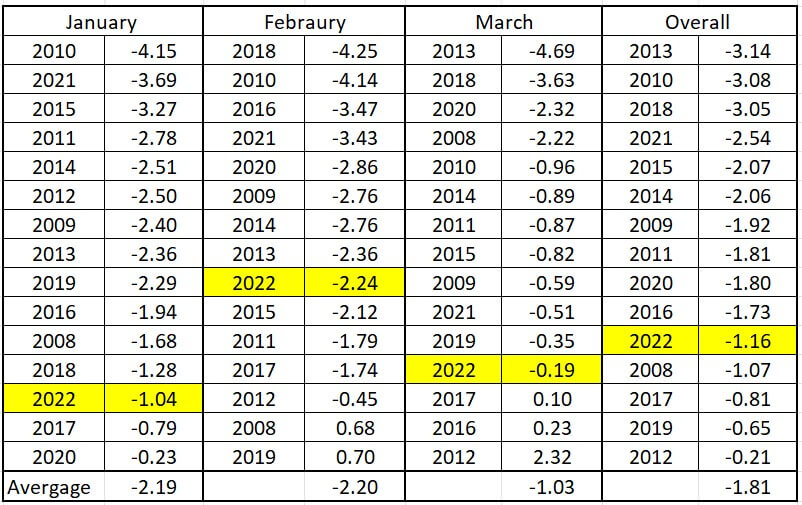
A table showing the average January, February and March Aonach Mor midday air temperature. I have ranked them in terms of coldest to warmest, and highlighted this season in yellow. February was the coldest month, both the relative and absolute terms scraping in just below average. Both January and March were above average, but not exceptionally so. Overall this January to March period was the 5th warmest in the past 15 years.Â

The January to March Aonach Mor midday temperature in graphical form. This year was slightly warmer than average, but nothing exceptional.Â
Comments on this post
Got something to say? Leave a comment


Jon M Eden
31st March 2022 8:44 pm
Very interesting stats. Is there a way I can save them somewhere as it would be interesting to look again in future.
Regards.
lochaberadmin
3rd April 2022 4:21 pm
Hi John, Glad you liked the stats, I posted some more on today’s blog. To produce these I downloaded the raw data from the website and did the analysis myself. Perhaps I should at some point post the all the numbers somewhere, but I am not sure where. Will have a think about that.