Interpreting Snow Profiles
13th January 2007
I thought it would be useful to try to give some assistance in interpreting the Snow Profiles that you will see now and again on the Blog.
These are prepared on a daily basis at a representative location of the current snow conditions. They are generally only dug down to the first stable layer. When I feel it is useful, I will post these on the Blog for all to see.
There now follows a key to all the symbols and their meanings. The symbols used are all Internationally recognised so once you get the hang of it here, you should be able to read these graphs anywhere.
Click here for the full text of the International Classification
I shall work through an example of a surface profile and summarise the important points in the International Classification: First of all, lets look at the following snow profile:
 The top section should be fairly self explanitory, however you should note that the Met Conditions are the mid day readings from the summit of Aonach Mor and the wind is a 24 hour vector average. The met conditions at the pit site are started in the comments. This is how it is recorded in Lochaber, other areas may do it differently.
Now looking at the graph, taking things from left to right:
Comments: This normally is used to record any shears in the snowpack. Here we use 2 main tests, the Shovel Test and the Rutshblock Test. Thus ES means an easy failure with a shovel test. WRB3 means a failure 3 with a walking rutchblock test. A walking rutshblocktest is an adaptation of the standard rutshblock test. The block size is approx 1m by 1m and you don’t use skis. Click on this link for a description of the Rutshblock Test. Subsitute the new size and read boot every time it mentions ski in the description.
F: This is the international symbol for Snow Crystal Tipe. Summary info is given below. For more info, click on the International Classification link above.
 E: This is simply the snow crystal diameter in mm.
R: This is the snow hardness. In the field, we measure this with a simple hand test. It is recorded on the form using the international symbols: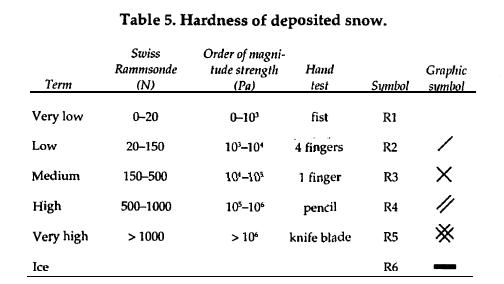
θ: This is the symbol for water content as follows: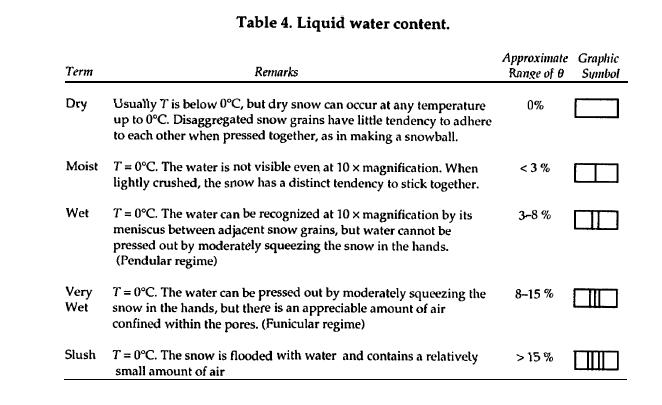
To the right hand side, there is a pictorial representation of the different hardnesses for each layer (scale along the bottom). Superimposed on top of this is the temperature profile of the snowpack (scale along the top).
So there it is in a nutshell. Hopefully you will be able to make better sense of it all now!
Comments on this post
Got something to say? Leave a comment